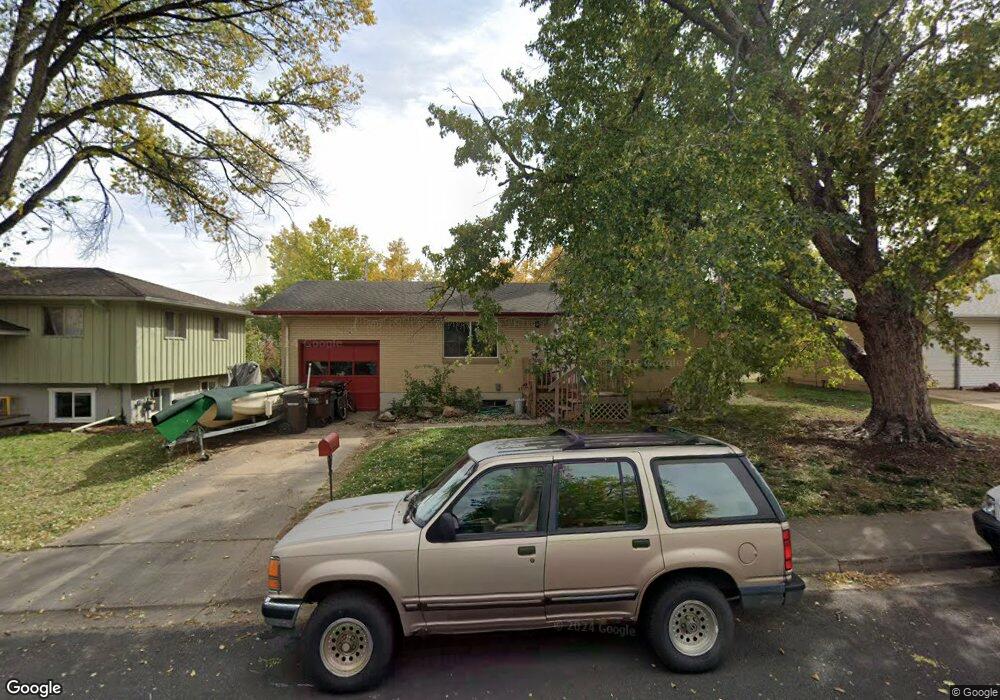
1230 Aikins Way Boulder, CO 80305
South Boulder NeighborhoodEstimated Value: $938,585 - $1,107,000
4
Beds
2
Baths
1,657
Sq Ft
$612/Sq Ft
Est. Value
About This Home
This home is located at 1230 Aikins Way, Boulder, CO 80305 and is currently estimated at $1,013,396, approximately $611 per square foot. 1230 Aikins Way is a home located in Boulder County with nearby schools including Creekside Elementary School, Southern Hills Middle School, and Fairview High School.
Ownership History
Date
Name
Owned For
Owner Type
Purchase Details
Closed on
Oct 9, 2009
Sold by
Nelson Ted
Bought by
Mccutchan Cheryl
Current Estimated Value
Home Financials for this Owner
Home Financials are based on the most recent Mortgage that was taken out on this home.
Original Mortgage
$373,117
Outstanding Balance
$243,888
Interest Rate
5.1%
Mortgage Type
FHA
Estimated Equity
$769,508
Purchase Details
Closed on
Jul 24, 2008
Sold by
Luntsford Family Trust
Bought by
Nelson Ted
Home Financials for this Owner
Home Financials are based on the most recent Mortgage that was taken out on this home.
Original Mortgage
$276,000
Interest Rate
6.4%
Mortgage Type
Purchase Money Mortgage
Purchase Details
Closed on
May 2, 2006
Sold by
Luntsford Donald W and Estate Of Donald W Luntsford S
Bought by
The Luntsford Family Trust
Purchase Details
Closed on
Jul 8, 1965
Bought by
Mccutchan Cheryl and Mccutchan James
Create a Home Valuation Report for This Property
The Home Valuation Report is an in-depth analysis detailing your home's value as well as a comparison with similar homes in the area
Home Values in the Area
Average Home Value in this Area
Purchase History
| Date | Buyer | Sale Price | Title Company |
|---|---|---|---|
| Mccutchan Cheryl | $380,000 | Security Title | |
| Nelson Ted | $345,000 | Landamerica | |
| The Luntsford Family Trust | -- | None Available | |
| Mccutchan Cheryl | -- | -- |
Source: Public Records
Mortgage History
| Date | Status | Borrower | Loan Amount |
|---|---|---|---|
| Open | Mccutchan Cheryl | $373,117 | |
| Previous Owner | Nelson Ted | $276,000 |
Source: Public Records
Tax History Compared to Growth
Tax History
| Year | Tax Paid | Tax Assessment Tax Assessment Total Assessment is a certain percentage of the fair market value that is determined by local assessors to be the total taxable value of land and additions on the property. | Land | Improvement |
|---|---|---|---|---|
| 2025 | $4,963 | $52,619 | $29,325 | $23,294 |
| 2024 | $4,963 | $52,619 | $29,325 | $23,294 |
| 2023 | $4,877 | $56,474 | $34,659 | $25,500 |
| 2022 | $4,293 | $46,224 | $25,798 | $20,426 |
| 2021 | $4,093 | $47,555 | $26,541 | $21,014 |
| 2020 | $3,984 | $45,768 | $25,097 | $20,671 |
| 2019 | $3,923 | $45,768 | $25,097 | $20,671 |
| 2018 | $3,563 | $41,098 | $23,112 | $17,986 |
| 2017 | $3,452 | $45,436 | $25,552 | $19,884 |
| 2016 | $3,263 | $37,698 | $16,079 | $21,619 |
| 2015 | $3,090 | $29,372 | $11,303 | $18,069 |
| 2014 | $2,470 | $29,372 | $11,303 | $18,069 |
Source: Public Records
Map
Nearby Homes
- 4630 MacKy Way
- 4475 Hastings Dr
- 1019 Tantra Park Cir
- 4814 W Moorhead Cir
- 1533 Bradley Dr
- 4350 Butler Cir
- 4733 W Moorhead Cir
- 1596 Bradley Dr Unit 105C
- 850 W Moorhead Cir Unit 3L
- 3360 S Broadway
- 860 W Moorhead Cir Unit I
- 860 W Moorhead Cir Unit 2K
- 860 W Moorhead Cir Unit 2H
- 4204 Greenbriar Blvd Unit 45
- 960 Toedtli Dr
- 800 W Moorhead Cir Unit E
- 750 W Moorhead Cir Unit A
- 725 S 45th St
- 4763 Tantra Dr Unit B
- 1720 S Marshall Rd Unit 24
- 1236 Aikins Way
- 1226 Aikins Way
- 4625 MacKy Way
- 4615 MacKy Way
- 4635 MacKy Way
- 1220 Aikins Way
- 1240 Aikins Way
- 1227 Aikins Way
- 1233 Aikins Way
- 4605 MacKy Way
- 4645 MacKy Way
- 1223 Aikins Way
- 1237 Aikins Way
- 1216 Aikins Way
- 0 Aikins Way
- 1246 Aikins Way
- 1215 Aikins Way
- 4655 MacKy Way
- 4601 MacKy Way
- 1243 Aikins Way