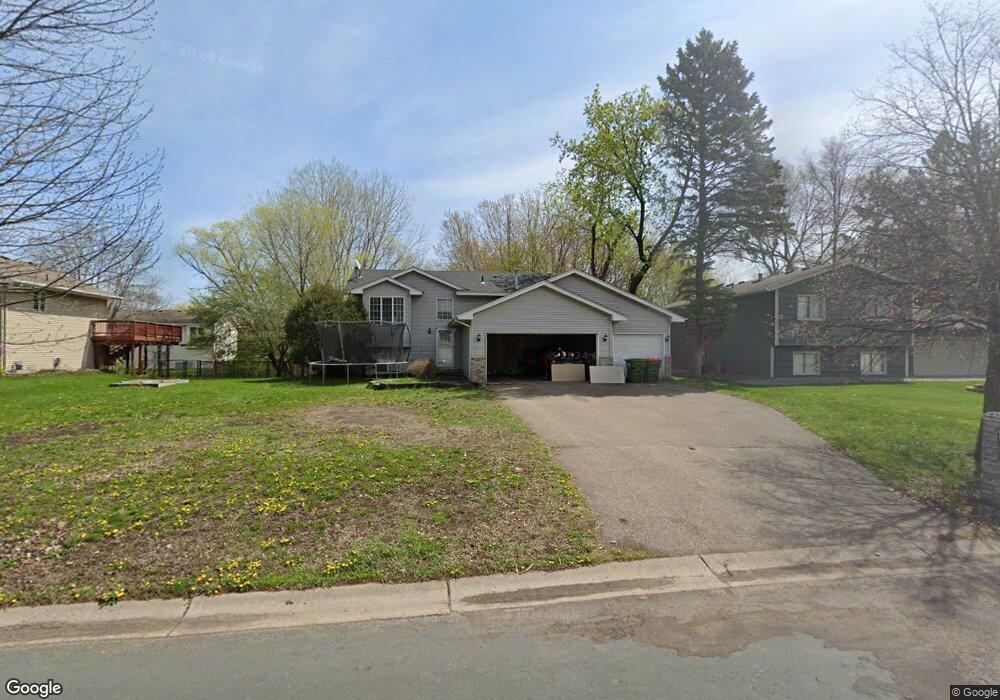
12303 Thrush St NW Coon Rapids, MN 55448
Estimated Value: $382,000 - $402,000
4
Beds
2
Baths
1,016
Sq Ft
$385/Sq Ft
Est. Value
About This Home
This home is located at 12303 Thrush St NW, Coon Rapids, MN 55448 and is currently estimated at $391,454, approximately $385 per square foot. 12303 Thrush St NW is a home located in Anoka County with nearby schools including Lucile Bruner Elementary School, Hoover Elementary School, and Laughlin Junior/Senior High School.
Ownership History
Date
Name
Owned For
Owner Type
Purchase Details
Closed on
Nov 8, 2019
Sold by
Purmort Homes Inc
Bought by
Walker Howard and Walker Wendy
Current Estimated Value
Purchase Details
Closed on
Mar 12, 2009
Sold by
Fanie Mae
Bought by
Jones Stephanie M
Home Financials for this Owner
Home Financials are based on the most recent Mortgage that was taken out on this home.
Original Mortgage
$164,700
Interest Rate
5.11%
Mortgage Type
New Conventional
Purchase Details
Closed on
May 25, 2000
Sold by
Shade Tree Construction Inc
Bought by
Ziemann David W and Jenkauski Denise J
Purchase Details
Closed on
Sep 2, 1999
Sold by
Tsm Development Inc
Bought by
Shade Tree Construction Inc
Create a Home Valuation Report for This Property
The Home Valuation Report is an in-depth analysis detailing your home's value as well as a comparison with similar homes in the area
Home Values in the Area
Average Home Value in this Area
Purchase History
| Date | Buyer | Sale Price | Title Company |
|---|---|---|---|
| Walker Howard | $286,900 | Titlesmart Inc | |
| Jones Stephanie M | $183,000 | -- | |
| Ziemann David W | $152,800 | -- | |
| Shade Tree Construction Inc | $274,900 | -- |
Source: Public Records
Mortgage History
| Date | Status | Borrower | Loan Amount |
|---|---|---|---|
| Previous Owner | Jones Stephanie M | $164,700 |
Source: Public Records
Tax History Compared to Growth
Tax History
| Year | Tax Paid | Tax Assessment Tax Assessment Total Assessment is a certain percentage of the fair market value that is determined by local assessors to be the total taxable value of land and additions on the property. | Land | Improvement |
|---|---|---|---|---|
| 2025 | $4,261 | $350,400 | $94,600 | $255,800 |
| 2024 | $4,261 | $348,600 | $104,500 | $244,100 |
| 2023 | $3,928 | $340,800 | $90,200 | $250,600 |
| 2022 | $3,616 | $337,000 | $77,000 | $260,000 |
| 2021 | $3,472 | $277,500 | $64,900 | $212,600 |
| 2020 | $3,748 | $268,300 | $69,300 | $199,000 |
| 2019 | $2,967 | $269,100 | $73,700 | $195,400 |
| 2018 | $2,727 | $249,100 | $0 | $0 |
| 2017 | $2,289 | $224,200 | $0 | $0 |
| 2016 | $2,291 | $185,700 | $0 | $0 |
| 2015 | -- | $185,700 | $53,600 | $132,100 |
| 2014 | -- | $169,300 | $52,800 | $116,500 |
Source: Public Records
Map
Nearby Homes
- 2068 124th Ln NW
- 2147 125th Ln NW
- 12760 Raven St NW
- 12019 Zion St NW
- 2675 128th Ave NW
- 12365 Jay St NW
- 1930 127th Cir NW
- 1727 121st Ln NW
- 12888 Nightingale St NW
- 12554 Grouse St NW
- 11749 Crooked Lake Blvd NW
- 1593 126th Ln NW
- 3074 121st Ave NW
- 12759 Ibis St NW
- 12463 Drake St NW
- 12010 Eagle St NW
- 11444 Hanson Blvd NW
- 12189 Lily St NW
- 1450 126th Ln NW
- 11409 Quinn St NW
- 12297 Thrush St NW
- 12309 Thrush St NW
- 12241 Thrush St NW
- 12300 Thrush St NW
- 12304 Swallow St NW
- 12310 Swallow St NW
- 12308 Thrush St NW
- 12315 Thrush St NW
- 12284 Thrush St NW
- 12308 12308 Thrush St NW
- 12252 Thrush St NW
- 12316 Thrush St NW
- 12316 Swallow St NW
- 12321 Thrush St NW
- 12235 Thrush St NW
- 12307 Swallow St NW
- 12236 Thrush St NW
- 12322 Swallow St NW
- 12324 Thrush St NW
- 12217 Thrush St NW