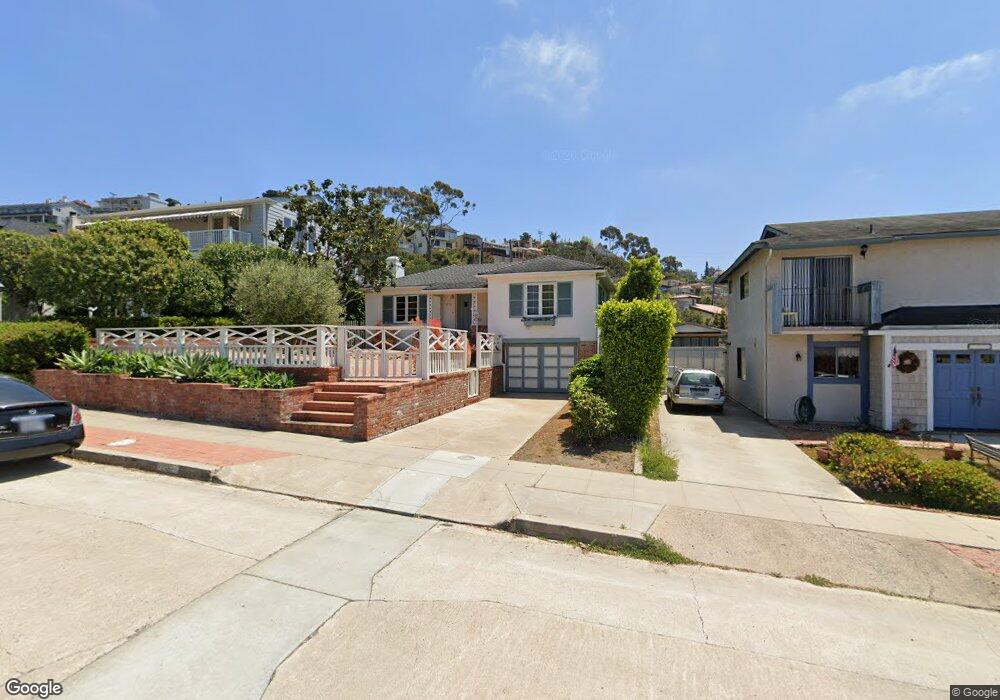
1231 Virginia Way La Jolla, CA 92037
The Village NeighborhoodEstimated Value: $2,809,060 - $4,436,000
2
Beds
2
Baths
1,900
Sq Ft
$1,768/Sq Ft
Est. Value
About This Home
This home is located at 1231 Virginia Way, La Jolla, CA 92037 and is currently estimated at $3,360,015, approximately $1,768 per square foot. 1231 Virginia Way is a home located in San Diego County with nearby schools including La Jolla Elementary School, Muirlands Middle School, and La Jolla High School.
Ownership History
Date
Name
Owned For
Owner Type
Purchase Details
Closed on
Dec 21, 2012
Sold by
Sipe Jack C
Bought by
Sipe Bonnie B
Current Estimated Value
Purchase Details
Closed on
Dec 18, 2012
Sold by
V Way Properties Llc
Bought by
Allen Patricia D and Patricia D Allen Separate Property Livin
Purchase Details
Closed on
Mar 5, 2010
Sold by
Sipe Bonnie B
Bought by
V Way Properties Llc
Purchase Details
Closed on
Oct 12, 2006
Sold by
Sipe Bonnie Browne
Bought by
Sipe Bonnie B
Purchase Details
Closed on
Feb 28, 2003
Sold by
Power Maisie Eden
Bought by
Power Maisie Eden
Purchase Details
Closed on
Mar 1, 1996
Sold by
Taft Joseph H and Taft Elizabeth G
Bought by
Power Maisie Eden
Purchase Details
Closed on
Apr 6, 1994
Sold by
Taft Joseph Howard and Taft Elizabeth Gabriel
Bought by
Taft Joseph H and Taft Elizabeth G
Purchase Details
Closed on
Aug 4, 1983
Create a Home Valuation Report for This Property
The Home Valuation Report is an in-depth analysis detailing your home's value as well as a comparison with similar homes in the area
Home Values in the Area
Average Home Value in this Area
Purchase History
| Date | Buyer | Sale Price | Title Company |
|---|---|---|---|
| Sipe Bonnie B | -- | First American Title San Die | |
| Allen Patricia D | $1,600,000 | First American Title San Die | |
| V Way Properties Llc | -- | None Available | |
| Sipe Bonnie B | -- | None Available | |
| Sipe Bonnie Browne | -- | None Available | |
| Power Maisie Eden | -- | -- | |
| Power Maisie Eden | $432,500 | Commonwealth Land Title Co | |
| Taft Joseph H | -- | -- | |
| -- | $250,000 | -- |
Source: Public Records
Tax History Compared to Growth
Tax History
| Year | Tax Paid | Tax Assessment Tax Assessment Total Assessment is a certain percentage of the fair market value that is determined by local assessors to be the total taxable value of land and additions on the property. | Land | Improvement |
|---|---|---|---|---|
| 2025 | $23,841 | $1,977,264 | $1,847,139 | $130,125 |
| 2024 | $23,841 | $1,938,495 | $1,810,921 | $127,574 |
| 2023 | $23,316 | $1,900,486 | $1,775,413 | $125,073 |
| 2022 | $22,696 | $1,863,222 | $1,740,601 | $122,621 |
| 2021 | $22,541 | $1,826,689 | $1,706,472 | $120,217 |
| 2020 | $22,268 | $1,807,960 | $1,688,975 | $118,985 |
| 2019 | $21,870 | $1,772,510 | $1,655,858 | $116,652 |
| 2018 | $20,444 | $1,737,756 | $1,623,391 | $114,365 |
| 2017 | $19,959 | $1,703,683 | $1,591,560 | $112,123 |
| 2016 | $19,644 | $1,670,278 | $1,560,353 | $109,925 |
| 2015 | $19,354 | $1,645,190 | $1,536,916 | $108,274 |
| 2014 | $19,047 | $1,612,964 | $1,506,810 | $106,154 |
Source: Public Records
Map
Nearby Homes
- 1138 Virginia Way
- 7569 Pepita Way
- 7733 Girard Ave Unit 13
- 7505 Pepita Way
- 7651 Country Club Dr
- 7452 Herschel Ave
- 1428 Soledad Ave
- 1461 Virginia Way
- 7601 Eads Ave
- 1586 Crespo Dr
- 7757 Eads Ave Unit B7
- 7560 Eads Ave Unit 12
- 726 Silver St
- 708 Silver St
- 718 Silver St
- 7635 Draper Ave Unit LU4
- 7376 Fay Ave
- 7372 Fay Ave
- 1040 Genter St Unit 103
- 1040 Genter St Unit 104
- 1235 Virginia Way
- 1221 Virginia Way
- 1245 Virginia Way
- 1215 Virginia Way
- 1257 Virginia Way
- 1201 Olivet St
- 1211 Virginia Way
- 7577 Cabrillo Ave
- 7578 Cabrillo Ave
- 1208 Virginia Way
- 1263 Virginia Way
- 1214 Virginia Way
- 7569 Cabrillo Ave
- 1221 Olivet St
- 1224 Virginia Way
- 1201 Virginia Way
- 1236 Virginia Way
- 7564 Cabrillo Ave
- 7617 High Ave
- 1271 Virginia Way