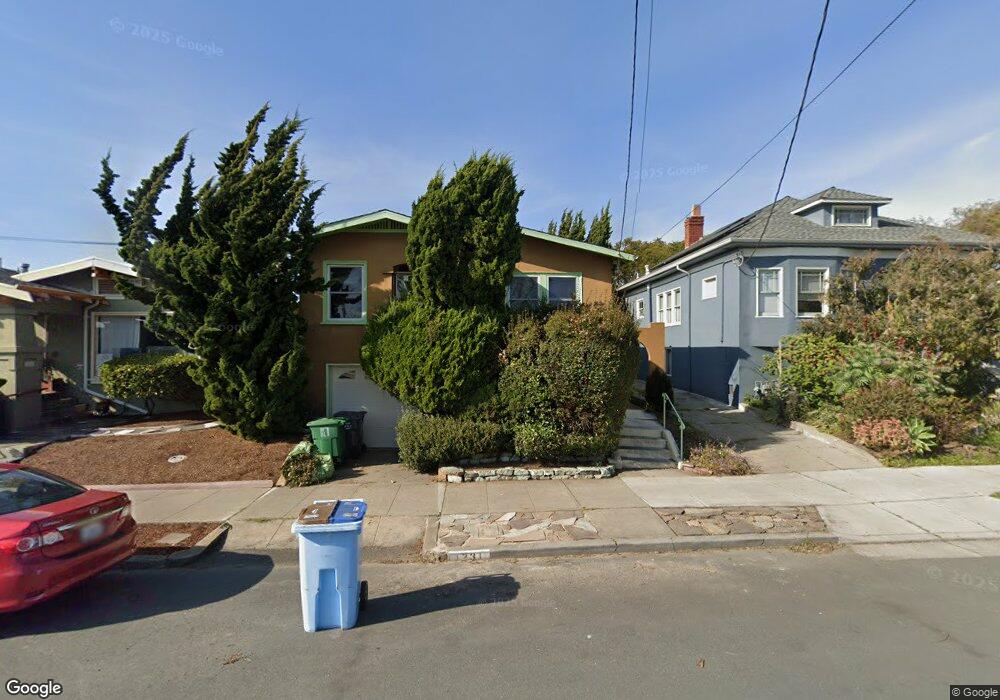
1231 Ward St Berkeley, CA 94702
West Berkeley NeighborhoodEstimated Value: $1,172,027 - $1,289,000
2
Beds
1
Bath
1,127
Sq Ft
$1,074/Sq Ft
Est. Value
About This Home
This home is located at 1231 Ward St, Berkeley, CA 94702 and is currently estimated at $1,210,507, approximately $1,074 per square foot. 1231 Ward St is a home located in Alameda County with nearby schools including Malcolm X Elementary School, Oxford Elementary School, and Washington Elementary School.
Ownership History
Date
Name
Owned For
Owner Type
Purchase Details
Closed on
Feb 6, 2003
Sold by
Lai Au Duc D and Lai Mac Bang
Bought by
Davis Joel B and Davis Victoria C Z
Current Estimated Value
Home Financials for this Owner
Home Financials are based on the most recent Mortgage that was taken out on this home.
Original Mortgage
$350,000
Outstanding Balance
$149,021
Interest Rate
5.87%
Estimated Equity
$1,061,486
Create a Home Valuation Report for This Property
The Home Valuation Report is an in-depth analysis detailing your home's value as well as a comparison with similar homes in the area
Home Values in the Area
Average Home Value in this Area
Purchase History
| Date | Buyer | Sale Price | Title Company |
|---|---|---|---|
| Davis Joel B | $437,500 | Fidelity Title Company |
Source: Public Records
Mortgage History
| Date | Status | Borrower | Loan Amount |
|---|---|---|---|
| Open | Davis Joel B | $350,000 | |
| Closed | Davis Joel B | $87,500 |
Source: Public Records
Tax History
| Year | Tax Paid | Tax Assessment Tax Assessment Total Assessment is a certain percentage of the fair market value that is determined by local assessors to be the total taxable value of land and additions on the property. | Land | Improvement |
|---|---|---|---|---|
| 2025 | $10,453 | $626,586 | $190,148 | $443,438 |
| 2024 | $10,453 | $614,166 | $186,421 | $434,745 |
| 2023 | $10,226 | $608,990 | $182,766 | $426,224 |
| 2022 | $10,022 | $590,051 | $179,183 | $417,868 |
| 2021 | $10,032 | $578,348 | $175,671 | $409,677 |
| 2020 | $9,444 | $579,350 | $173,871 | $405,479 |
| 2019 | $9,018 | $567,992 | $170,462 | $397,530 |
| 2018 | $8,854 | $556,858 | $167,121 | $389,737 |
| 2017 | $8,532 | $545,942 | $163,845 | $382,097 |
| 2016 | $8,221 | $535,241 | $160,633 | $374,608 |
| 2015 | $8,106 | $527,204 | $158,221 | $368,983 |
| 2014 | $8,035 | $516,879 | $155,123 | $361,756 |
Source: Public Records
Map
Nearby Homes
- 2717 Mabel St
- 1135 Parker St
- 1034 Grayson St
- 1450 Ward St
- 2758 Sacramento St
- 2774 Sacramento St
- 2750 Sacramento St
- 2782 Sacramento St
- 2790 Sacramento St
- 1010 Grayson St
- 1142 Dwight Way
- 1144 Dwight Way
- 1118 Dwight Way
- 1515 Derby St
- 1237 Ashby Ave
- 1314 Ashby Ave
- 2922 Stanton St
- 1092 Dwight Way
- 3032 Mabel St
- 2829 California St
Your Personal Tour Guide
Ask me questions while you tour the home.