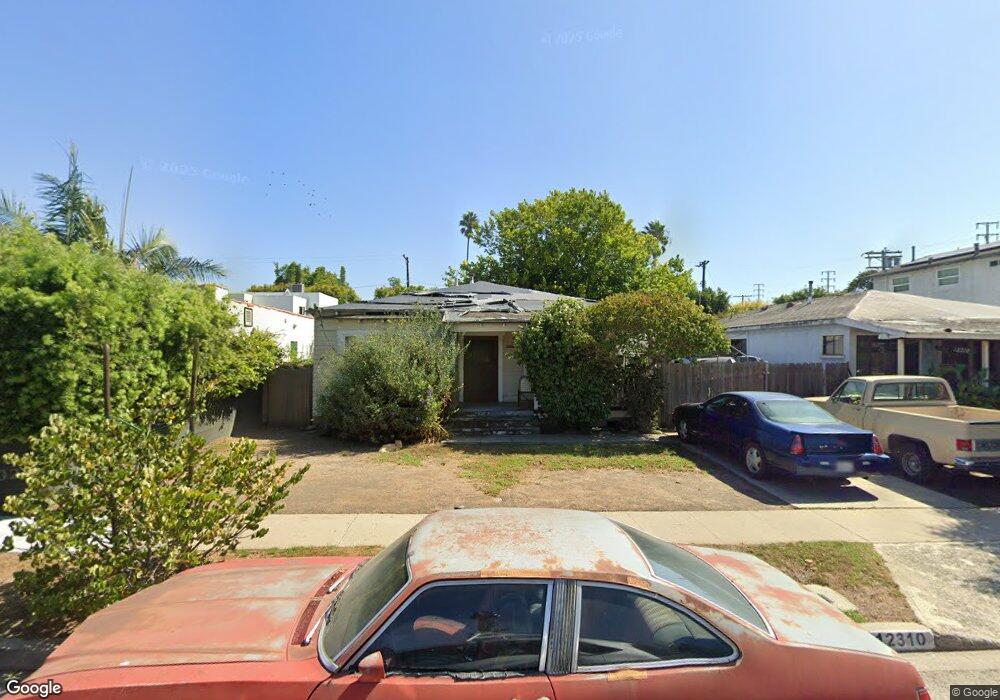
12310 Gilmore Ave Los Angeles, CA 90066
Del Rey NeighborhoodEstimated Value: $785,000 - $1,597,000
2
Beds
1
Bath
1,097
Sq Ft
$1,123/Sq Ft
Est. Value
About This Home
This home is located at 12310 Gilmore Ave, Los Angeles, CA 90066 and is currently estimated at $1,231,911, approximately $1,122 per square foot. 12310 Gilmore Ave is a home located in Los Angeles County with nearby schools including Braddock Drive Elementary School, Marina Del Rey Middle School, and Venice High School.
Ownership History
Date
Name
Owned For
Owner Type
Purchase Details
Closed on
Jan 31, 2019
Sold by
Ferraguto Richard
Bought by
Ferraguto John and The John Ferraguto 2007 Living
Current Estimated Value
Purchase Details
Closed on
Jan 10, 2019
Sold by
Ferraguto John and Victoria Ferraguto 2006 Living
Bought by
Ferraguto Thomas and Ferraguto John
Purchase Details
Closed on
Jun 25, 2018
Sold by
Ferraguto John
Bought by
Ferraguto John and John Ferraguto 2007 Living Trust
Purchase Details
Closed on
Jan 12, 2012
Sold by
Ferraguto John and Thomas M Ferraguto 2007 Living
Bought by
Ferraguto John and John Ferraguto 2007 Living Trust
Purchase Details
Closed on
Jan 13, 2007
Sold by
Ferraguto Thomas M
Bought by
Ferraguto Thomas M and Thomas M Ferraguto 2007 Living Trust
Purchase Details
Closed on
Nov 22, 2006
Sold by
Ferraguto John and Virginia Ferraguto 2006 Living
Bought by
Ferraguto Thomas M
Purchase Details
Closed on
Feb 7, 2006
Sold by
Ferraguto Victoria
Bought by
Ferraguto Victoria and Victoria Ferraguto 2006 Living Trust
Create a Home Valuation Report for This Property
The Home Valuation Report is an in-depth analysis detailing your home's value as well as a comparison with similar homes in the area
Home Values in the Area
Average Home Value in this Area
Purchase History
| Date | Buyer | Sale Price | Title Company |
|---|---|---|---|
| Ferraguto John | $280,000 | None Available | |
| Ferraguto Thomas | -- | Accommodation | |
| Ferraguto John | -- | None Available | |
| Ferraguto John | -- | None Available | |
| Ferraguto Thomas M | -- | None Available | |
| Ferraguto John | -- | None Available | |
| Ferraguto Thomas M | -- | None Available | |
| Ferraguto Victoria | -- | None Available |
Source: Public Records
Tax History Compared to Growth
Tax History
| Year | Tax Paid | Tax Assessment Tax Assessment Total Assessment is a certain percentage of the fair market value that is determined by local assessors to be the total taxable value of land and additions on the property. | Land | Improvement |
|---|---|---|---|---|
| 2025 | $5,852 | $481,441 | $355,256 | $126,185 |
| 2024 | $5,852 | $472,002 | $348,291 | $123,711 |
| 2023 | $5,743 | $462,748 | $341,462 | $121,286 |
| 2022 | $5,480 | $453,675 | $334,767 | $118,908 |
| 2021 | $5,408 | $444,780 | $328,203 | $116,577 |
| 2019 | $3,093 | $172,965 | $125,593 | $47,372 |
| 2018 | $2,169 | $169,575 | $123,131 | $46,444 |
| 2016 | $2,067 | $162,992 | $118,350 | $44,642 |
| 2015 | $2,038 | $160,545 | $116,573 | $43,972 |
| 2014 | $2,055 | $157,401 | $114,290 | $43,111 |
Source: Public Records
Map
Nearby Homes
- 4506 Grand View Blvd
- 4430 Lindblade Dr
- 12056 Culver Blvd
- 4632 Marshall Dr
- 12479 Walsh Ave
- 4266 Grand View Blvd
- 4316 Westlawn Ave
- 4430 Inglewood Blvd
- 11938 Courtleigh Dr Unit 3
- 4242 Grand View Blvd
- 4591 Inglewood Blvd Unit 3
- 12044 Washington Blvd
- 12531 Culver Blvd
- 12537 Rubens Ave
- 4852 S Centinela Ave
- 11905 Avon Way
- 4220 Kenyon Ave
- 11831 Courtleigh Dr Unit 203
- 12030 Sylvester St
- 4912 S Centinela Ave
- 12308 Gilmore Ave
- 12318 Gilmore Ave
- 12322 Gilmore Ave
- 12304 Gilmore Ave
- 12315 Greene Ave
- 12309 Greene Ave
- 12319 Greene Ave
- 12300 Gilmore Ave
- 4459 Campbell Dr
- 12305 Greene Ave
- 12317 Gilmore Ave
- 12228 Gilmore Ave
- 12301 Greene Ave
- 4536 S Centinela Ave Unit 1/2
- 4546 S Centinela Ave
- 4451 Campbell Dr
- 12229 Greene Ave
- 12224 Gilmore Ave
- 4536 1/2 S Centinela Ave
- 12225 Greene Ave