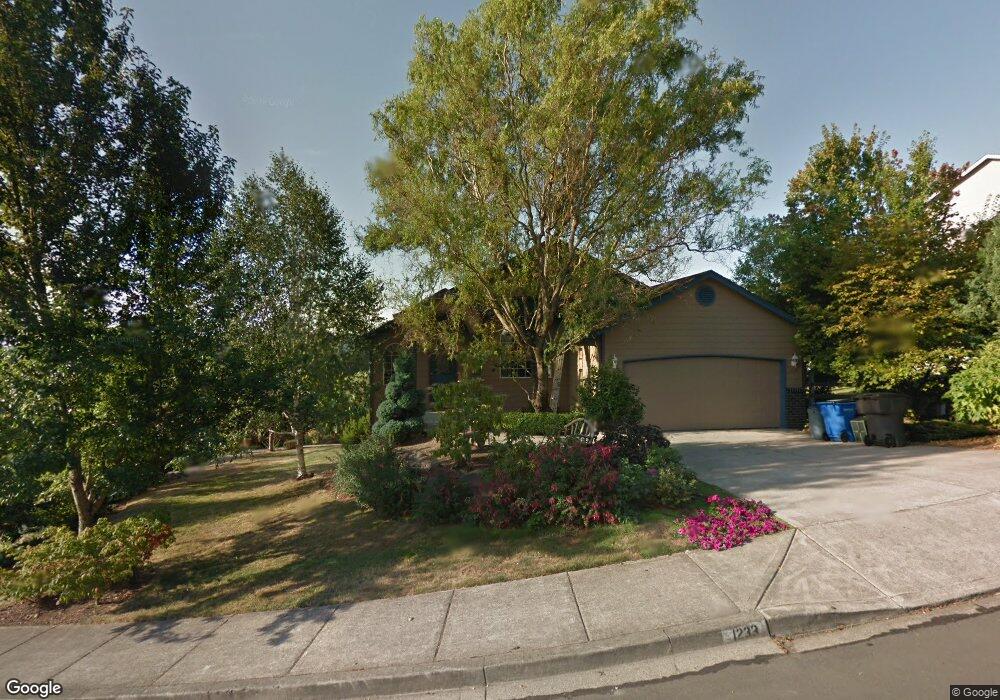
1233 E Pioneer Loop La Center, WA 98629
Estimated Value: $606,000 - $652,000
3
Beds
2
Baths
1,700
Sq Ft
$369/Sq Ft
Est. Value
About This Home
Property Id: 1668781
Light & bright! Walk-in to 1700sf, 3 bedrooms, 2 baths ranch style home, laundry room, balcony and gas fireplace. Gazebo outside with grape vines, blueberries, strawberries and space for gardening. Southview Heights neighborhood.
First, last and deposit. Water, sewer and garbage paid by landlord.
Ownership History
Date
Name
Owned For
Owner Type
Purchase Details
Closed on
Nov 9, 1999
Sold by
Wise Associates Llc
Bought by
Lanphear Sandra L
Current Estimated Value
Home Financials for this Owner
Home Financials are based on the most recent Mortgage that was taken out on this home.
Original Mortgage
$134,400
Outstanding Balance
$41,251
Interest Rate
7.82%
Estimated Equity
$585,465
Purchase Details
Closed on
Aug 10, 1998
Sold by
New Castle Investments Inc
Bought by
Wise Associates Llc
Home Financials for this Owner
Home Financials are based on the most recent Mortgage that was taken out on this home.
Original Mortgage
$160,000
Interest Rate
6.95%
Create a Home Valuation Report for This Property
The Home Valuation Report is an in-depth analysis detailing your home's value as well as a comparison with similar homes in the area
Home Values in the Area
Average Home Value in this Area
Purchase History
| Date | Buyer | Sale Price | Title Company |
|---|---|---|---|
| Lanphear Sandra L | $168,000 | Chicago Title Insurance Co | |
| Wise Associates Llc | -- | First American Title Ins Co |
Source: Public Records
Mortgage History
| Date | Status | Borrower | Loan Amount |
|---|---|---|---|
| Open | Lanphear Sandra L | $134,400 | |
| Previous Owner | Wise Associates Llc | $160,000 |
Source: Public Records
Property History
| Date | Event | Price | List to Sale | Price per Sq Ft |
|---|---|---|---|---|
| 12/10/2024 12/10/24 | Off Market | $2,300 | -- | -- |
| 12/01/2024 12/01/24 | Price Changed | $2,300 | -11.4% | $1 / Sq Ft |
| 11/23/2024 11/23/24 | For Rent | $2,595 | -- | -- |
Tax History
| Year | Tax Paid | Tax Assessment Tax Assessment Total Assessment is a certain percentage of the fair market value that is determined by local assessors to be the total taxable value of land and additions on the property. | Land | Improvement |
|---|---|---|---|---|
| 2025 | $5,316 | $589,633 | $185,400 | $404,233 |
| 2024 | $4,956 | $574,081 | $185,400 | $388,681 |
| 2023 | $4,813 | $557,682 | $180,000 | $377,682 |
| 2022 | $4,711 | $523,002 | $141,500 | $381,502 |
| 2021 | $4,627 | $454,203 | $114,200 | $340,003 |
| 2020 | $4,475 | $420,093 | $106,400 | $313,693 |
| 2019 | $4,352 | $397,193 | $96,260 | $300,933 |
| 2018 | $3,956 | $393,227 | $0 | $0 |
| 2017 | $3,458 | $352,616 | $0 | $0 |
| 2016 | $3,406 | $326,797 | $0 | $0 |
Source: Public Records
Map
Nearby Homes
- 703 E Stonecreek Dr
- 734 E 15th Cir
- 1296 E Lucas St
- 1241 E Southview Heights Dr
- 1189 E Ennis Ct
- 594 E 5th St
- 525 E 17th Cir
- 1319 Aspen Ave
- 135 E Airedale Ave
- 306 E 16th Place
- 725 Aspen Ave
- 134 E Joyce Ct
- 108 W 16th St
- 1214 W Avocet Place
- 1202 W Avocet Place
- 703 E Tanoak Ave
- 2031 E 9th St
- 2027 E Otter Loop Unit 68
- 2019 E Otter Loop Unit 70
- 2035 E Otter Loop Unit 66
- 1223 E Pioneer Loop
- 1209 E Pioneer Loop
- 1241 E Pioneer Loop
- 1236 E Pioneer Loop
- 1240 E Pioneer Loop
- 1203 E Pioneer Loop
- 1297 E Timmen Ct
- 1230 E Pioneer Loop
- 1212 E Pioneer Loop
- 1247 E Pioneer Loop
- 1218 E Pioneer Loop
- 1244 E Pioneer Loop
- 1295 E Timmen Ct
- 1206 E Pioneer Loop
- 1127 E Pioneer Loop
- 1298 E Timmen Ct
- 1248 E Pioneer Loop
- 1200 E Pioneer Loop
- 1249 E Pioneer Loop
- 1348 E 14th Cir
Your Personal Tour Guide
Ask me questions while you tour the home.