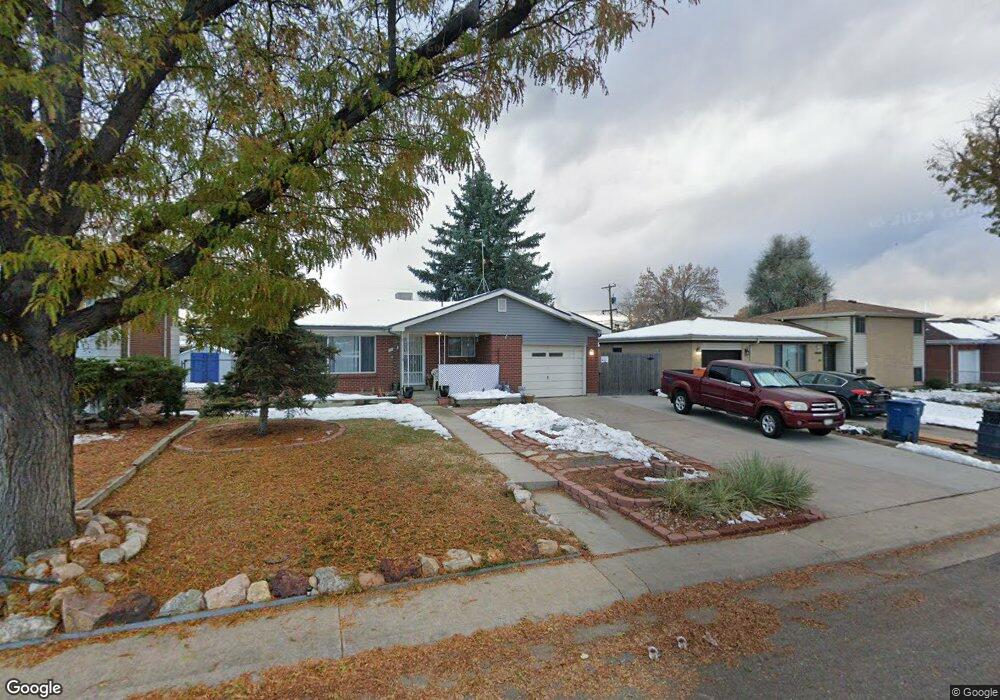
12332 E 30th Ave Aurora, CO 80011
Morris Heights NeighborhoodEstimated Value: $313,000 - $478,000
3
Beds
2
Baths
2,352
Sq Ft
$175/Sq Ft
Est. Value
About This Home
This home is located at 12332 E 30th Ave, Aurora, CO 80011 and is currently estimated at $410,944, approximately $174 per square foot. 12332 E 30th Ave is a home located in Adams County with nearby schools including Park Lane Elementary School, North Middle School Health Sciences & Technology, and Hinkley High School.
Ownership History
Date
Name
Owned For
Owner Type
Purchase Details
Closed on
Oct 31, 2022
Sold by
Baldridge Living Trust
Bought by
Baldridge Joel William
Current Estimated Value
Purchase Details
Closed on
Dec 18, 2015
Sold by
Baldridge Adele Arlene
Bought by
Baldridge Living Trust
Purchase Details
Closed on
Dec 22, 2010
Sold by
Baldridge Sarah
Bought by
Baldridge Adele Arlene
Purchase Details
Closed on
Jun 30, 2010
Sold by
Fannie Mae
Bought by
Baldridge Sarah
Purchase Details
Closed on
Jun 17, 2010
Sold by
Bywater Norman O
Bought by
Federal National Mortgage Association
Create a Home Valuation Report for This Property
The Home Valuation Report is an in-depth analysis detailing your home's value as well as a comparison with similar homes in the area
Home Values in the Area
Average Home Value in this Area
Purchase History
| Date | Buyer | Sale Price | Title Company |
|---|---|---|---|
| Baldridge Joel William | -- | -- | |
| Baldridge Living Trust | -- | None Available | |
| Baldridge Adele Arlene | -- | None Available | |
| Baldridge Sarah | $104,000 | Assured Title | |
| Federal National Mortgage Association | -- | None Available |
Source: Public Records
Tax History
| Year | Tax Paid | Tax Assessment Tax Assessment Total Assessment is a certain percentage of the fair market value that is determined by local assessors to be the total taxable value of land and additions on the property. | Land | Improvement |
|---|---|---|---|---|
| 2025 | $2,441 | $25,230 | $5,780 | $19,450 |
| 2024 | $2,441 | $23,190 | $5,310 | $17,880 |
| 2023 | $2,480 | $26,990 | $5,750 | $21,240 |
| 2022 | $2,353 | $20,710 | $5,490 | $15,220 |
| 2021 | $2,452 | $20,710 | $5,490 | $15,220 |
| 2020 | $2,363 | $20,020 | $5,650 | $14,370 |
| 2019 | $2,358 | $20,020 | $5,650 | $14,370 |
| 2018 | $1,680 | $14,200 | $5,040 | $9,160 |
| 2017 | $1,492 | $14,200 | $5,040 | $9,160 |
| 2016 | $1,374 | $12,970 | $2,590 | $10,380 |
| 2015 | $1,331 | $12,970 | $2,590 | $10,380 |
| 2014 | -- | $10,560 | $2,150 | $8,410 |
Source: Public Records
Map
Nearby Homes
- 2381 Oswego St
- 3123 Uvalda St
- 11589 E 25th Dr
- 1656 N Newark St
- 2381 Nome St
- 3219 Uvalda St
- 2522 Moline St
- 2521 Moline St
- 2861 Lima St
- 11336 E 27th Ave
- 3206 Vaughn St
- 11273 E 28th Place
- 3090 Worchester St
- 11185 E 25th Ave
- 3131 Xanadu St
- 11059 E 25th Dr
- 2209 Macon St
- 1990 Newark St
- 3065 Zion St
- 1945 Nome St
- 12300 E 30th Ave
- 12372 E 30th Ave
- 12298 E 30th Ave
- 12333 E Park Lane Dr
- 12303 E Park Lane Dr
- 12353 E Park Lane Dr
- 12301 E 30th Ave
- 12335 E 30th Ave
- 12299 E Park Lane Dr
- 12373 E Park Lane Dr
- 12392 E 30th Ave
- 12236 E 30th Ave
- 12275 E 30th Ave
- 12363 E 30th Ave
- 12247 E Park Lane Dr
- 12393 E Park Lane Dr
- 12402 E 30th Ave
- 12235 E 30th Ave
- 12381 E 30th Ave
- 12207 E Park Lane Dr
Your Personal Tour Guide
Ask me questions while you tour the home.