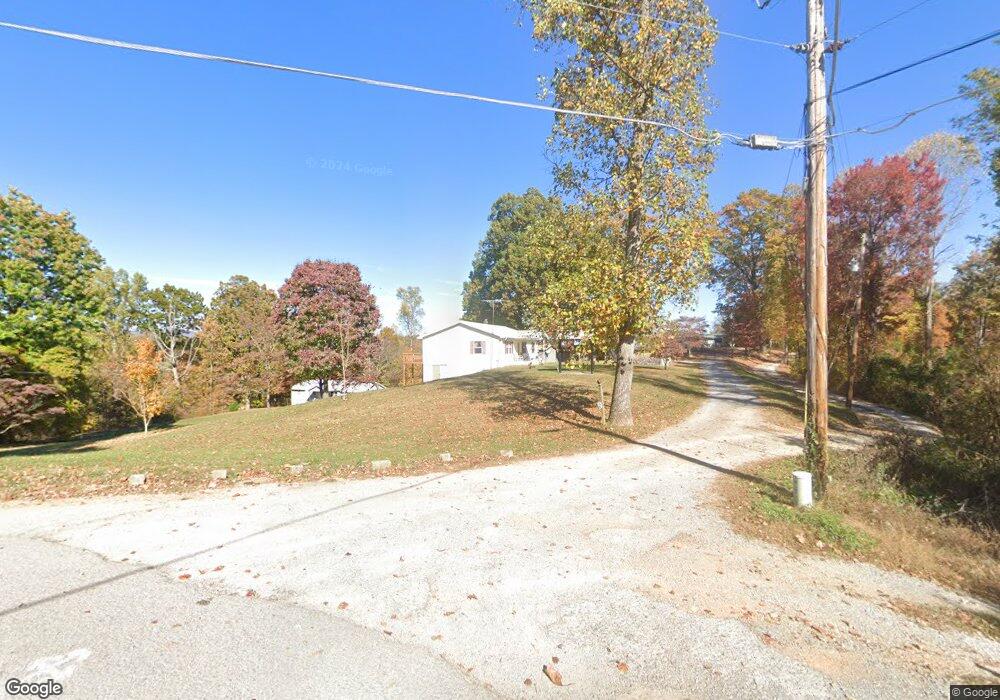
1234 Sugar Hollow Rd La Follette, TN 37766
Estimated Value: $165,179 - $251,000
--
Bed
1
Bath
960
Sq Ft
$229/Sq Ft
Est. Value
About This Home
This home is located at 1234 Sugar Hollow Rd, La Follette, TN 37766 and is currently estimated at $220,295, approximately $229 per square foot. 1234 Sugar Hollow Rd is a home located in Campbell County.
Ownership History
Date
Name
Owned For
Owner Type
Purchase Details
Closed on
Aug 26, 2025
Sold by
Morris Marie
Bought by
Leach Lisa and Morris Renee
Current Estimated Value
Purchase Details
Closed on
Sep 27, 1977
Bought by
Morris Donald Ray and Morris Marie
Create a Home Valuation Report for This Property
The Home Valuation Report is an in-depth analysis detailing your home's value as well as a comparison with similar homes in the area
Home Values in the Area
Average Home Value in this Area
Purchase History
| Date | Buyer | Sale Price | Title Company |
|---|---|---|---|
| Leach Lisa | -- | None Listed On Document | |
| Morris Donald Ray | -- | -- |
Source: Public Records
Tax History Compared to Growth
Tax History
| Year | Tax Paid | Tax Assessment Tax Assessment Total Assessment is a certain percentage of the fair market value that is determined by local assessors to be the total taxable value of land and additions on the property. | Land | Improvement |
|---|---|---|---|---|
| 2025 | $464 | $38,200 | $0 | $0 |
| 2024 | $464 | $38,200 | $6,800 | $31,400 |
| 2023 | $310 | $16,600 | $2,275 | $14,325 |
| 2022 | $310 | $16,600 | $2,275 | $14,325 |
| 2021 | $310 | $16,600 | $2,275 | $14,325 |
| 2020 | $304 | $16,600 | $2,275 | $14,325 |
| 2019 | $310 | $16,600 | $2,275 | $14,325 |
| 2018 | $310 | $15,600 | $2,275 | $13,325 |
| 2017 | $310 | $15,600 | $2,275 | $13,325 |
| 2016 | $310 | $15,600 | $2,275 | $13,325 |
| 2015 | $310 | $15,600 | $2,275 | $13,325 |
| 2014 | -- | $15,600 | $2,275 | $13,325 |
| 2013 | -- | $15,600 | $2,275 | $13,325 |
Source: Public Records
Map
Nearby Homes
- 2473 Long Hollow Rd
- 258 Marina Ln
- 309 Marina Ln
- 689 Ivey Hollow Rd
- 647 Coolidge Rd
- 286 Lewis White Ln
- 0 Mariner Point Rd
- 174 Old Ivey Hollow Rd
- 0 Cedar Creek Rd
- 0 Low Gap Rd Unit 18767562
- 0 Low Gap Rd Unit 11277254
- 129 Bridgeview Ln
- 679 Waterfront Tr
- 1971 Demory Rd
- 143 Northbridge Ln
- 143 N Bridge Ln
- 121 Hidden Ln
- 143 Hidden Ln
- 1123 Pleasant Ridge Rd
- 734 Waterfront Tr
- 1256 Sugar Hollow Rd
- 1260 Sugar Hollow Rd
- 1236 Sugar Hollow Rd
- 1216 Sugar Hollow Rd
- 1238 Sugar Hollow Rd
- 1238 Sugar Hollow Rd
- 1302 Sugar Hollow Rd
- 1192 Sugar Hollow Rd
- 1196 Sugar Hollow Rd
- 152 Easter Ln
- 152 Easter Ln
- 1328 Sugar Hollow Rd
- 1328 Sugar Hollow Rd
- 179 Easter Ln
- 1374 Sugar Hollow Rd
- 134 Windrush Ln
- 183 Easter Ln
- 148 Windrush Ln
- 203 Easter Ln
- 203 Easter Ln