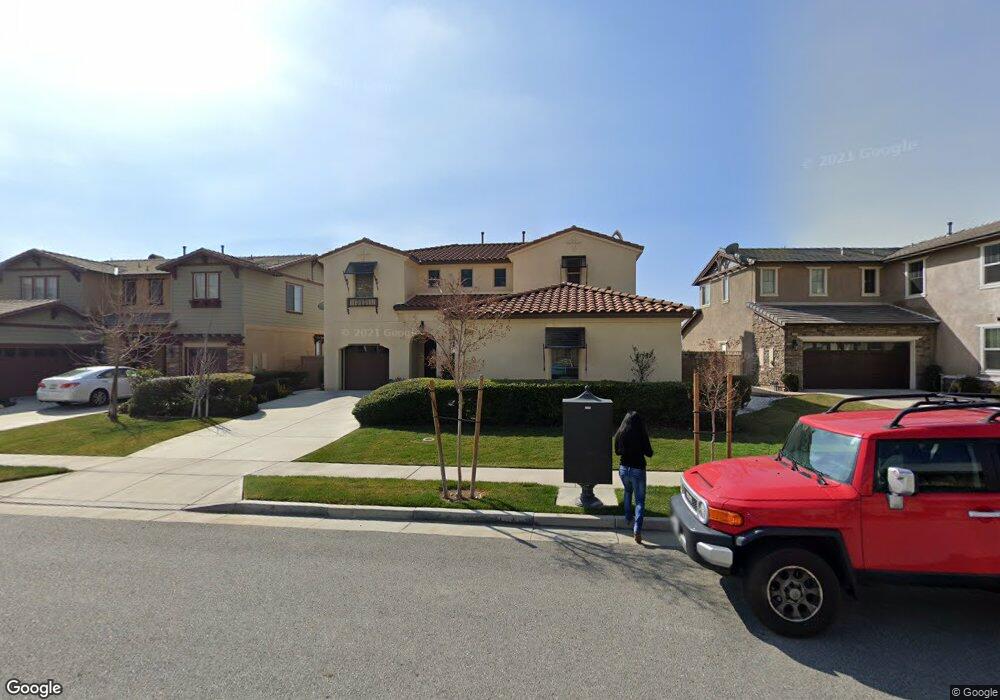
12341 Macon Dr Rancho Cucamonga, CA 91739
Etiwanda NeighborhoodEstimated Value: $1,117,308 - $1,393,000
4
Beds
3
Baths
2,879
Sq Ft
$429/Sq Ft
Est. Value
About This Home
This home is located at 12341 Macon Dr, Rancho Cucamonga, CA 91739 and is currently estimated at $1,233,827, approximately $428 per square foot. 12341 Macon Dr is a home located in San Bernardino County with nearby schools including John L. Golden Elementary, Day Creek Intermediate, and Los Osos High.
Ownership History
Date
Name
Owned For
Owner Type
Purchase Details
Closed on
Jul 9, 2014
Sold by
Chu Frank Weishien
Bought by
Chu Family Trust
Current Estimated Value
Purchase Details
Closed on
Jan 23, 2014
Sold by
Chu Ben
Bought by
Chu Frank Weishien and Chu Iris Liyueh
Purchase Details
Closed on
Sep 12, 2011
Sold by
Chu Ben
Bought by
Chu Ben and Ben Chu Living Trust
Purchase Details
Closed on
Jun 4, 2009
Sold by
Rancho Estates At Etiwanda/Af 37 Llc
Bought by
Chu Ben
Home Financials for this Owner
Home Financials are based on the most recent Mortgage that was taken out on this home.
Original Mortgage
$367,200
Outstanding Balance
$232,752
Interest Rate
4.83%
Mortgage Type
Purchase Money Mortgage
Estimated Equity
$1,001,075
Create a Home Valuation Report for This Property
The Home Valuation Report is an in-depth analysis detailing your home's value as well as a comparison with similar homes in the area
Home Values in the Area
Average Home Value in this Area
Purchase History
| Date | Buyer | Sale Price | Title Company |
|---|---|---|---|
| Chu Family Trust | -- | None Available | |
| Chu Frank Weishien | -- | None Available | |
| Chu Ben | -- | None Available | |
| Chu Ben | $459,000 | Fidelity National Title |
Source: Public Records
Mortgage History
| Date | Status | Borrower | Loan Amount |
|---|---|---|---|
| Open | Chu Ben | $367,200 |
Source: Public Records
Tax History Compared to Growth
Tax History
| Year | Tax Paid | Tax Assessment Tax Assessment Total Assessment is a certain percentage of the fair market value that is determined by local assessors to be the total taxable value of land and additions on the property. | Land | Improvement |
|---|---|---|---|---|
| 2025 | $11,364 | $718,358 | $251,304 | $467,054 |
| 2024 | $11,364 | $704,272 | $246,376 | $457,896 |
| 2023 | $11,181 | $690,463 | $241,545 | $448,918 |
| 2022 | $11,096 | $676,925 | $236,809 | $440,116 |
| 2021 | $10,971 | $663,652 | $232,166 | $431,486 |
| 2020 | $11,373 | $656,847 | $229,785 | $427,062 |
| 2019 | $11,173 | $643,967 | $225,279 | $418,688 |
| 2018 | $11,565 | $631,340 | $220,862 | $410,478 |
| 2017 | $11,244 | $618,960 | $216,531 | $402,429 |
| 2016 | $11,055 | $606,823 | $212,285 | $394,538 |
| 2015 | $11,084 | $597,708 | $209,096 | $388,612 |
| 2014 | $9,687 | $482,178 | $169,129 | $313,049 |
Source: Public Records
Map
Nearby Homes
- 5231 Flora Ct
- 12619 Dupont Dr
- 12798 N Rim Way
- 5450 Stagecoach Ct
- 12487 Altura Dr
- 12877 Golden Prairie Dr
- 12430 Split Rein Dr
- 12406 Challendon Dr
- 13123 Carriage Trail Ct
- 5054 Sagewood Dr
- 6197 Greenwood Place
- 11090 Hiddentrail Dr
- 5506 Carriage Place
- 12794 Windstar Dr
- 5156 Branding Iron Place
- 5075 Branding Iron Place
- 6264 Shore Pine Ct
- 13812 Breeders Cup Dr
- 10919 Boulder Canyon Rd
- 11021 Cedar Creek Dr