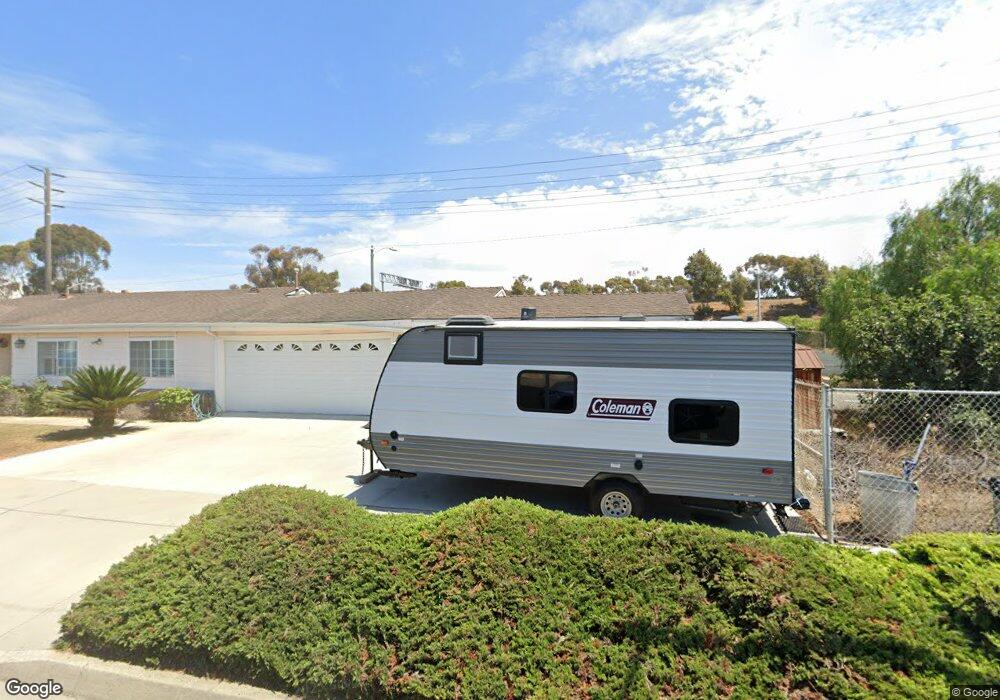
12342 Glasgow Place Hawthorne, CA 90250
Del Aire NeighborhoodEstimated Value: $1,042,000 - $1,202,000
3
Beds
2
Baths
1,480
Sq Ft
$764/Sq Ft
Est. Value
About This Home
This home is located at 12342 Glasgow Place, Hawthorne, CA 90250 and is currently estimated at $1,130,874, approximately $764 per square foot. 12342 Glasgow Place is a home located in Los Angeles County with nearby schools including Del Aire Elementary School, Richard Henry Dana Middle School, and Da Vinci Communications High School.
Ownership History
Date
Name
Owned For
Owner Type
Purchase Details
Closed on
Jan 19, 2022
Sold by
Yukie Mizufuka
Bought by
Yukie Mizufuka 2004 Trust
Current Estimated Value
Purchase Details
Closed on
Sep 11, 2019
Sold by
Mizufuka Yukie
Bought by
Mizufuka Cathy
Purchase Details
Closed on
Jul 11, 2019
Sold by
Mizufuka Cathy
Bought by
Mizufuka Yukie
Purchase Details
Closed on
Jul 14, 2008
Sold by
Nakanishi Tammy and The Jim Masaaki Minamoto 2004
Bought by
Mizufuka Cathy
Purchase Details
Closed on
Jun 16, 2008
Sold by
Nakanishi Tammy
Bought by
Mizufuka Yukie
Purchase Details
Closed on
Jun 12, 2008
Sold by
Minamoto June
Bought by
Mizufuka Yukie
Purchase Details
Closed on
May 18, 2004
Sold by
Mizufuka Yukie
Bought by
Mizufuka Yukie and The Yukie Mizufuka 2004 Trust
Purchase Details
Closed on
Mar 17, 2004
Sold by
Minamoto Masaaki Jim
Bought by
Minamoto Jim Masaaki and The Jim Masaaki Minamoto 2004
Create a Home Valuation Report for This Property
The Home Valuation Report is an in-depth analysis detailing your home's value as well as a comparison with similar homes in the area
Home Values in the Area
Average Home Value in this Area
Purchase History
| Date | Buyer | Sale Price | Title Company |
|---|---|---|---|
| Yukie Mizufuka 2004 Trust | -- | Beach Cities Estate Law | |
| Mizufuka Cathy | -- | None Available | |
| Mizufuka Yukie | -- | None Available | |
| Mizufuka Cathy | -- | None Available | |
| Mizufuka Yukie | -- | None Available | |
| Mizufuka Yukie | -- | None Available | |
| Mizufuka Yukie | -- | -- | |
| Minamoto Jim Masaaki | -- | -- |
Source: Public Records
Tax History Compared to Growth
Tax History
| Year | Tax Paid | Tax Assessment Tax Assessment Total Assessment is a certain percentage of the fair market value that is determined by local assessors to be the total taxable value of land and additions on the property. | Land | Improvement |
|---|---|---|---|---|
| 2025 | $6,138 | $454,590 | $303,309 | $151,281 |
| 2024 | $6,138 | $445,677 | $297,362 | $148,315 |
| 2023 | $5,921 | $436,939 | $291,532 | $145,407 |
| 2022 | $7,774 | $585,499 | $390,304 | $195,195 |
| 2021 | $5,691 | $419,973 | $280,212 | $139,761 |
| 2020 | $5,654 | $415,667 | $277,339 | $138,328 |
| 2019 | $5,649 | $407,517 | $271,901 | $135,616 |
| 2018 | $5,473 | $399,527 | $266,570 | $132,957 |
| 2017 | $5,360 | $391,694 | $261,344 | $130,350 |
| 2016 | $5,272 | $384,015 | $256,220 | $127,795 |
| 2015 | $5,256 | $378,248 | $252,372 | $125,876 |
| 2014 | $5,206 | $370,840 | $247,429 | $123,411 |
Source: Public Records
Map
Nearby Homes
- 12102 S La Cienega Blvd
- 5340 W 122nd St
- 5048 W 121st St
- 5357 W 122nd St
- 12621 Costa Dr
- 5254 W 127th St
- 5126 W El Segundo Blvd
- 5468 W 120th St
- 5475 W 121st St
- 5017 W 118th Place
- 5116 W 130th St
- 5030 W 130th St
- 5533 W 118th Place
- 5547 Strand Unit 101
- 13023 Union Ave Unit 106
- 12913 Mission Ave Unit 108
- 5451 W 117th St
- 5518 W 117th St
- 5526 W 117th St
- 5448 W 116th St
- 12308 Glasgow Place
- 5219 W 123rd Place
- 12327 Glasgow Place
- 12302 Glasgow Place
- 5225 W 123rd Place
- 5218 W 123rd St
- 5224 W 123rd Place
- 3723 W 123rd St
- 5224 W 123rd St
- 5229 W 123rd Place
- 5228 W 123rd Place
- 5223 W 124th St
- 5228 W 123rd St
- 5235 W 123rd Place
- 5234 W 123rd Place
- 5229 W 124th St
- 5234 W 123rd St
- 5241 W 123rd Place
- 5235 W 124th St
- 5240 W 123rd Place