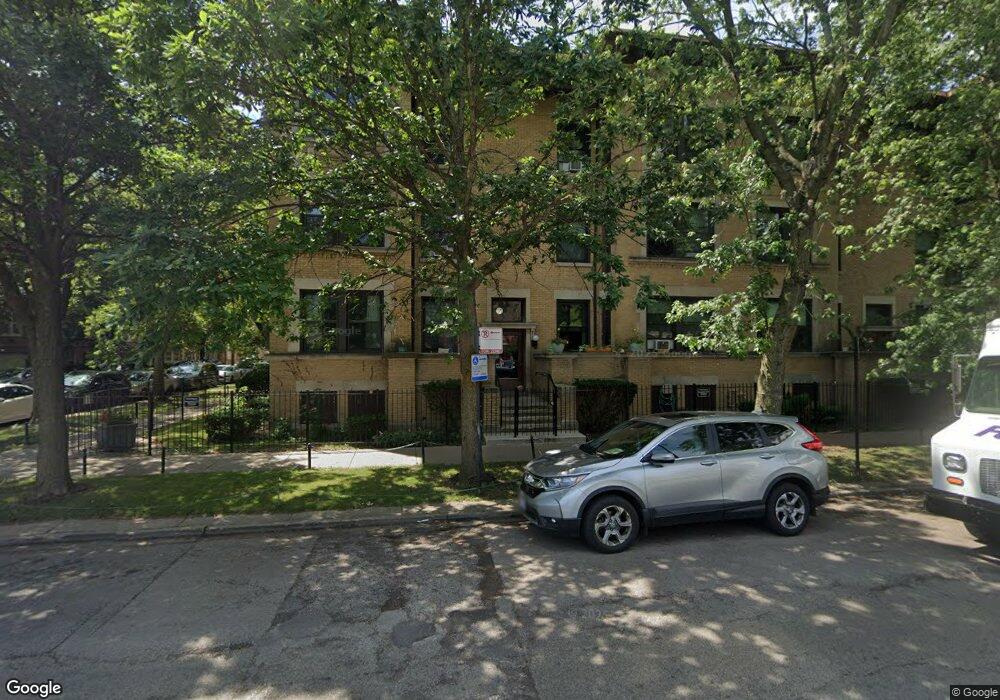
1235 E 53rd St Unit 12353 Chicago, IL 60615
Hyde Park NeighborhoodEstimated Value: $281,000 - $295,000
3
Beds
--
Bath
--
Sq Ft
0.39
Acres
About This Home
This home is located at 1235 E 53rd St Unit 12353, Chicago, IL 60615 and is currently estimated at $288,374. 1235 E 53rd St Unit 12353 is a home located in Cook County with nearby schools including Ray Elementary School, Kenwood Academy High School, and St. Thomas the Apostle Elementary School.
Ownership History
Date
Name
Owned For
Owner Type
Purchase Details
Closed on
Jul 23, 2025
Sold by
Chase Diane Z and Chase Arlen F
Bought by
Botticello Peter Robert and Botticello-Romero Nuria Roxana
Current Estimated Value
Home Financials for this Owner
Home Financials are based on the most recent Mortgage that was taken out on this home.
Original Mortgage
$275,000
Outstanding Balance
$274,514
Interest Rate
6.63%
Mortgage Type
New Conventional
Estimated Equity
$13,860
Purchase Details
Closed on
May 13, 2022
Sold by
Malamy Jocelyn E
Bought by
Chase Diane Z and Chase Arlen F
Purchase Details
Closed on
Dec 15, 2006
Sold by
Reimer Jacob and Byrnes Jake
Bought by
Malamy Jocelyn E
Home Financials for this Owner
Home Financials are based on the most recent Mortgage that was taken out on this home.
Original Mortgage
$180,000
Interest Rate
6.24%
Mortgage Type
Purchase Money Mortgage
Create a Home Valuation Report for This Property
The Home Valuation Report is an in-depth analysis detailing your home's value as well as a comparison with similar homes in the area
Home Values in the Area
Average Home Value in this Area
Purchase History
| Date | Buyer | Sale Price | Title Company |
|---|---|---|---|
| Botticello Peter Robert | $290,000 | None Listed On Document | |
| Chase Diane Z | $274,500 | First American Title | |
| Malamy Jocelyn E | $225,000 | Multiple |
Source: Public Records
Mortgage History
| Date | Status | Borrower | Loan Amount |
|---|---|---|---|
| Open | Botticello Peter Robert | $275,000 | |
| Previous Owner | Malamy Jocelyn E | $180,000 |
Source: Public Records
Tax History Compared to Growth
Tax History
| Year | Tax Paid | Tax Assessment Tax Assessment Total Assessment is a certain percentage of the fair market value that is determined by local assessors to be the total taxable value of land and additions on the property. | Land | Improvement |
|---|---|---|---|---|
| 2024 | $3,533 | $22,923 | $5,625 | $17,298 |
| 2023 | $3,410 | $20,000 | $4,536 | $15,464 |
| 2022 | $3,410 | $20,000 | $4,536 | $15,464 |
| 2021 | $3,352 | $19,999 | $4,536 | $15,463 |
| 2020 | $2,954 | $16,363 | $3,628 | $12,735 |
| 2019 | $2,891 | $17,819 | $3,628 | $14,191 |
| 2018 | $2,841 | $17,819 | $3,628 | $14,191 |
| 2017 | $2,687 | $15,859 | $2,993 | $12,866 |
| 2016 | $2,676 | $15,859 | $2,993 | $12,866 |
| 2015 | $2,425 | $15,859 | $2,993 | $12,866 |
| 2014 | $1,532 | $10,823 | $2,449 | $8,374 |
| 2013 | $1,490 | $10,823 | $2,449 | $8,374 |
Source: Public Records
Map
Nearby Homes
- 1213 E 53rd St Unit 3W
- 5312 S Woodlawn Ave Unit 1
- 5235 S University Ave
- 1223 E 52nd St Unit 1
- 5230 S University Ave Unit D
- 1155 E Hyde Park Blvd Unit 2F
- 5110 S Woodlawn Ave Unit 3H
- 5108 S Woodlawn Ave Unit 2G
- 5114 S Kenwood Ave Unit PHB
- 5114 S Kenwood Ave Unit 4B
- 5114 S Kenwood Ave Unit PHA
- 5114 S Kenwood Ave Unit 3B
- 5133 S Greenwood Ave Unit 2
- 5121 S Kimbark Ave Unit 1E
- 1059 E Hyde Park Blvd Unit 1
- 1000 E 53rd St Unit 119S
- 1000 E 53rd St Unit 511S
- 5142 S Greenwood Ave Unit 1
- 1006 E 54th St Unit J-2
- 1234 E Madison Park Unit 3W
- 1235 E 53rd St Unit 12351
- 1235 E 53rd St Unit 12352
- 1235 E 53rd St Unit 1
- 1231 E 53rd St Unit 12313
- 1231 E 53rd St Unit 12311
- 1231 E 53rd St Unit 12312
- 1231 E 53rd St Unit 3W
- 1231 E 53rd St Unit 2
- 1231 E 53rd St Unit 1
- 1233 E 53rd St Unit 12332
- 1233 E 53rd St Unit 12333
- 1233 E 53rd St Unit 12331
- 1233 E 53rd St Unit 2
- 1215 E 53rd St Unit 1E
- 1215 E 53rd St Unit 3E
- 1215 E 53rd St Unit 2E
- 1213 E 53rd St Unit 1W
- 1213 E 53rd St Unit 2W
- 1213 E 53rd St Unit 1
- 1213 E 53rd St Unit 3