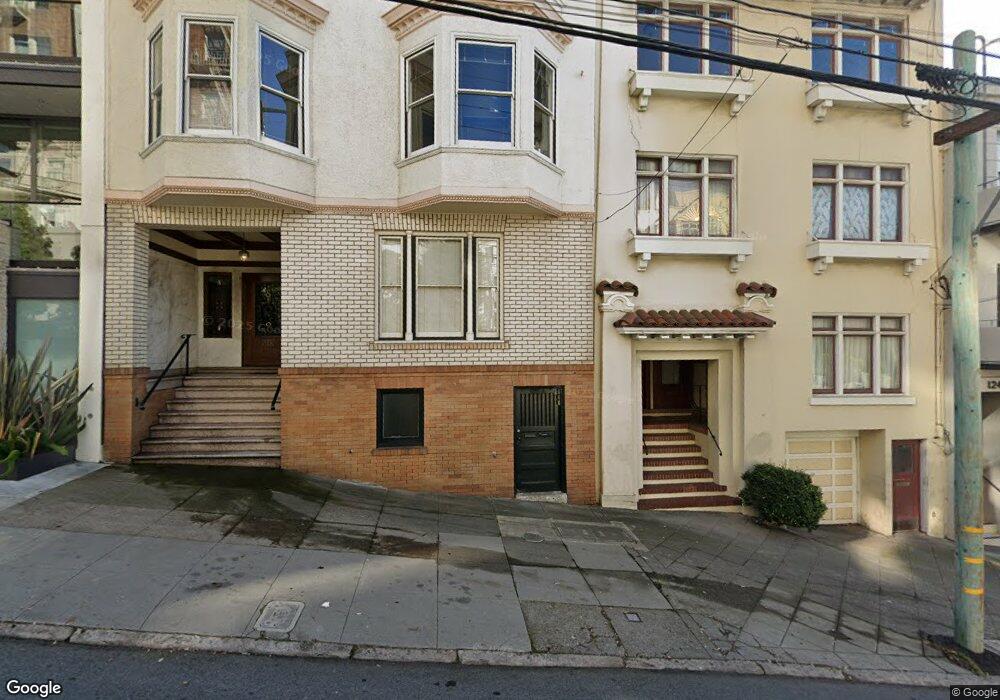
1235 Filbert St Unit 1239 San Francisco, CA 94109
Russian Hill NeighborhoodEstimated Value: $2,159,000 - $3,472,000
--
Bed
4
Baths
4,550
Sq Ft
$594/Sq Ft
Est. Value
About This Home
This home is located at 1235 Filbert St Unit 1239, San Francisco, CA 94109 and is currently estimated at $2,700,504, approximately $593 per square foot. 1235 Filbert St Unit 1239 is a home located in San Francisco County with nearby schools including Yick Wo Elementary School, Francisco Middle School, and Saint Brigid Academy.
Ownership History
Date
Name
Owned For
Owner Type
Purchase Details
Closed on
Apr 27, 2021
Sold by
Chu Arthur
Bought by
Chu Arthur and Arthur Chu Revocable Trust
Current Estimated Value
Purchase Details
Closed on
Apr 18, 2002
Sold by
Chu Arthur
Bought by
Chu Arthur
Home Financials for this Owner
Home Financials are based on the most recent Mortgage that was taken out on this home.
Original Mortgage
$503,000
Interest Rate
7.13%
Mortgage Type
Commercial
Purchase Details
Closed on
Apr 13, 2001
Sold by
Arthur Chu
Bought by
Chu Arthur
Home Financials for this Owner
Home Financials are based on the most recent Mortgage that was taken out on this home.
Original Mortgage
$508,000
Interest Rate
6.98%
Mortgage Type
Commercial
Purchase Details
Closed on
Apr 20, 2000
Sold by
Chu Arthur
Bought by
Chu Arthur
Purchase Details
Closed on
Apr 20, 1995
Sold by
Meyer Byron R
Bought by
Chu Arthur
Home Financials for this Owner
Home Financials are based on the most recent Mortgage that was taken out on this home.
Original Mortgage
$513,750
Interest Rate
8.44%
Mortgage Type
Construction
Create a Home Valuation Report for This Property
The Home Valuation Report is an in-depth analysis detailing your home's value as well as a comparison with similar homes in the area
Home Values in the Area
Average Home Value in this Area
Purchase History
| Date | Buyer | Sale Price | Title Company |
|---|---|---|---|
| Chu Arthur | -- | None Available | |
| Chu Arthur | -- | Fidelity National Title Co | |
| Chu Arthur | -- | Chicago Title Co | |
| Chu Arthur | -- | Chicago Title Co | |
| Chu Arthur | -- | Chicago Title Co | |
| Chu Arthur | -- | -- | |
| Chu Arthur | $685,000 | First American Title Ins Co |
Source: Public Records
Mortgage History
| Date | Status | Borrower | Loan Amount |
|---|---|---|---|
| Closed | Chu Arthur | $503,000 | |
| Closed | Chu Arthur | $508,000 | |
| Previous Owner | Chu Arthur | $513,750 |
Source: Public Records
Tax History Compared to Growth
Tax History
| Year | Tax Paid | Tax Assessment Tax Assessment Total Assessment is a certain percentage of the fair market value that is determined by local assessors to be the total taxable value of land and additions on the property. | Land | Improvement |
|---|---|---|---|---|
| 2025 | $13,285 | $1,150,582 | $587,893 | $562,689 |
| 2024 | $13,285 | $1,128,022 | $576,366 | $551,656 |
| 2023 | $13,094 | $1,105,905 | $565,065 | $540,840 |
| 2022 | $12,860 | $1,084,222 | $553,986 | $530,236 |
| 2021 | $12,637 | $1,062,964 | $543,124 | $519,840 |
| 2020 | $12,825 | $1,052,065 | $537,555 | $514,510 |
| 2019 | $12,389 | $1,031,437 | $527,015 | $504,422 |
| 2018 | $11,963 | $1,011,214 | $516,682 | $494,532 |
| 2017 | $12,149 | $991,387 | $506,551 | $484,836 |
| 2016 | $11,940 | $971,949 | $496,619 | $475,330 |
| 2015 | $11,790 | $957,351 | $489,160 | $468,191 |
| 2014 | $11,487 | $938,599 | $479,579 | $459,020 |
Source: Public Records
Map
Nearby Homes
- 2111 Hyde St Unit 505
- 2111 Hyde St Unit 403
- 2363 Larkin St Unit 34
- 1100 Union St Unit 1000
- 1100 Union St Unit 1100
- 16 Delgado Place
- 1925 Leavenworth St Unit 7
- 1380 Greenwich St Unit 205
- 1380 Greenwich St Unit 203
- 1728 Larkin St
- 1275 Lombard St
- 50 Montclair Terrace
- 2341 Leavenworth St
- 1145 Green St Unit 3
- 1405 Greenwich St Unit 3
- 941 Lombard St
- 1135 Green St
- 1268 Lombard St Unit 1
- 1101 Green St Unit 1801
- 1020 Union St Unit 19
- 1247 Filbert St Unit 1251
- 1261 Filbert St
- 1261 Filbert St
- 1209 Filbert St
- 1259 Filbert St
- 1259-1261 Filbert St
- 34 Allen St Unit 36
- 28 Allen St
- 2041 Hyde St Unit 2047
- 2041-2047 Hyde St
- 42 Allen St
- 30 Allen St
- 18 Allen St
- 2049 Hyde St Unit 2053
- 54 Allen St
- 52 Allen St Unit 2
- 52 Allen St Unit 1
- 2055 Hyde St
- 60 Allen St
- 58 Allen St Unit 58