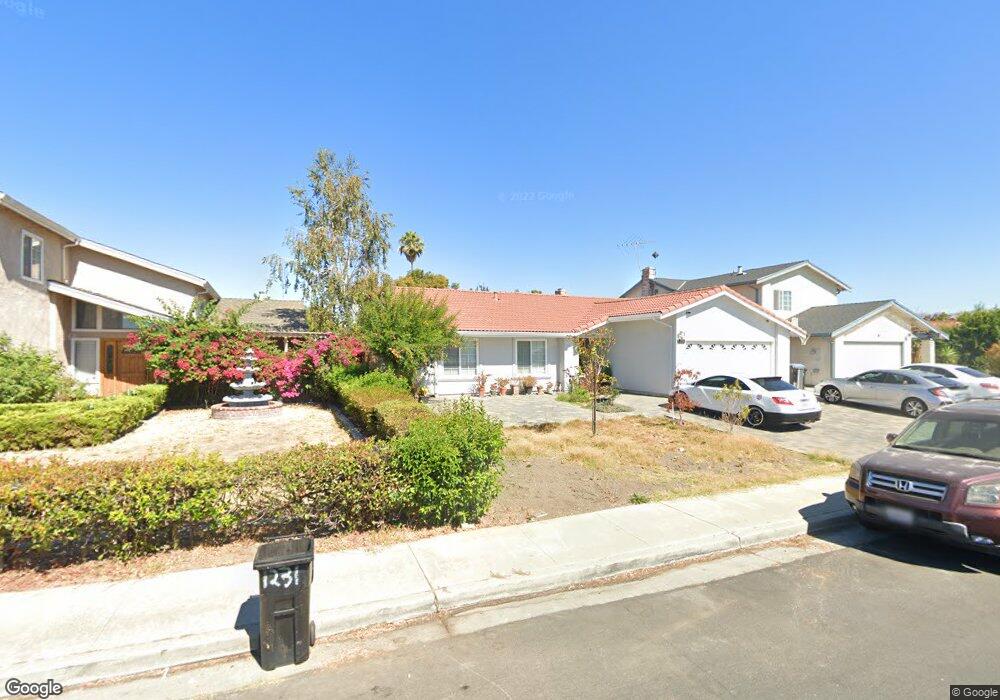
1235 Simonson Way San Jose, CA 95121
Stonegate NeighborhoodEstimated Value: $1,268,846 - $1,475,000
4
Beds
2
Baths
1,594
Sq Ft
$841/Sq Ft
Est. Value
About This Home
This home is located at 1235 Simonson Way, San Jose, CA 95121 and is currently estimated at $1,340,712, approximately $841 per square foot. 1235 Simonson Way is a home located in Santa Clara County with nearby schools including Windmill Springs Elementary School, Sylvandale Middle School, and Yerba Buena High School.
Ownership History
Date
Name
Owned For
Owner Type
Purchase Details
Closed on
Jul 20, 2024
Sold by
Ngo John Si and Giang Denise Diem
Bought by
Ngo Giang Living Trust and Ngo
Current Estimated Value
Purchase Details
Closed on
Jan 29, 2021
Sold by
Ngo John Si and Giang Denise Diem
Bought by
Ngo John Si and Giang Denise Diem
Home Financials for this Owner
Home Financials are based on the most recent Mortgage that was taken out on this home.
Original Mortgage
$445,000
Interest Rate
2.6%
Mortgage Type
New Conventional
Purchase Details
Closed on
Feb 12, 2015
Sold by
Giang Denise D and Ngo John Si
Bought by
Ngo John Si and Giang Denise D
Home Financials for this Owner
Home Financials are based on the most recent Mortgage that was taken out on this home.
Original Mortgage
$500,000
Interest Rate
3.66%
Mortgage Type
New Conventional
Purchase Details
Closed on
Mar 3, 2005
Sold by
Giang Denise Diem and Ngo John Si
Bought by
Ngo John Si and Giang Denise D
Home Financials for this Owner
Home Financials are based on the most recent Mortgage that was taken out on this home.
Original Mortgage
$300,000
Interest Rate
5.61%
Mortgage Type
New Conventional
Purchase Details
Closed on
May 18, 2004
Sold by
Tran Francis and Tran Lien
Bought by
Ngo John Si and Giang Denise Diem
Home Financials for this Owner
Home Financials are based on the most recent Mortgage that was taken out on this home.
Original Mortgage
$432,000
Interest Rate
5.12%
Mortgage Type
FHA
Purchase Details
Closed on
Aug 7, 2001
Sold by
Tran Francis
Bought by
Tran Francis and Tran Lien
Purchase Details
Closed on
Oct 2, 1999
Sold by
Cao Theresa T
Bought by
Tran Francis
Home Financials for this Owner
Home Financials are based on the most recent Mortgage that was taken out on this home.
Original Mortgage
$35,000
Interest Rate
7.77%
Mortgage Type
Credit Line Revolving
Purchase Details
Closed on
Aug 18, 1998
Sold by
Tran Francis and Cao Theresa Thi
Bought by
Tran Francis
Home Financials for this Owner
Home Financials are based on the most recent Mortgage that was taken out on this home.
Original Mortgage
$202,500
Interest Rate
6.91%
Purchase Details
Closed on
Oct 16, 1997
Sold by
Westbrook Vernon W and Westbrook Bonnie S
Bought by
Tran Francis and Cao Theresa Thi
Home Financials for this Owner
Home Financials are based on the most recent Mortgage that was taken out on this home.
Original Mortgage
$199,500
Interest Rate
7.33%
Create a Home Valuation Report for This Property
The Home Valuation Report is an in-depth analysis detailing your home's value as well as a comparison with similar homes in the area
Home Values in the Area
Average Home Value in this Area
Purchase History
| Date | Buyer | Sale Price | Title Company |
|---|---|---|---|
| Ngo Giang Living Trust | -- | None Listed On Document | |
| Ngo John Si | -- | Chicago Title Company | |
| Ngo John Si | -- | Cornerstone Title | |
| Ngo John Si | -- | Alliance Title Company | |
| Ngo John Si | $540,000 | Alliance Title Company | |
| Tran Francis | $97,000 | Chicago Title Co | |
| Tran Francis | -- | -- | |
| Tran Francis | -- | North American Title Co | |
| Tran Francis | $210,000 | Fidelity National Title Co |
Source: Public Records
Mortgage History
| Date | Status | Borrower | Loan Amount |
|---|---|---|---|
| Previous Owner | Ngo John Si | $445,000 | |
| Previous Owner | Ngo John Si | $500,000 | |
| Previous Owner | Ngo John Si | $300,000 | |
| Previous Owner | Ngo John Si | $432,000 | |
| Previous Owner | Tran Francis | $35,000 | |
| Previous Owner | Tran Francis | $202,500 | |
| Previous Owner | Tran Francis | $199,500 |
Source: Public Records
Tax History
| Year | Tax Paid | Tax Assessment Tax Assessment Total Assessment is a certain percentage of the fair market value that is determined by local assessors to be the total taxable value of land and additions on the property. | Land | Improvement |
|---|---|---|---|---|
| 2025 | $12,110 | $847,073 | $460,654 | $386,419 |
| 2024 | $12,110 | $830,465 | $451,622 | $378,843 |
| 2023 | $11,974 | $814,182 | $442,767 | $371,415 |
| 2022 | $11,706 | $798,219 | $434,086 | $364,133 |
| 2021 | $11,685 | $782,569 | $425,575 | $356,994 |
| 2020 | $12,996 | $774,546 | $421,212 | $353,334 |
| 2019 | $12,536 | $759,359 | $412,953 | $346,406 |
| 2018 | $12,535 | $744,470 | $404,856 | $339,614 |
| 2017 | $12,377 | $729,873 | $396,918 | $332,955 |
| 2016 | $11,847 | $715,563 | $389,136 | $326,427 |
| 2015 | $10,683 | $629,000 | $342,100 | $286,900 |
| 2014 | $6,942 | $492,500 | $295,500 | $197,000 |
Source: Public Records
Map
Nearby Homes
- 1314 Pellier Ct
- 2690 Mclaughlin Ave
- 2582 Tosca Way
- 2739 Mclaughlin Ave
- 2698 Kendrick Cir
- 1079 Drexel Way
- 1322 Becket Dr
- 2372 Balme Dr
- 2606 Apollo Dr
- 2825 Aetna Way
- 2456 Kenoga Dr
- 2252 Denair Ave
- 2315 Warfield Way Unit B
- 1371 Sunnycrest Cir
- 2197 Summerton Dr
- 2175 Summerton Dr
- 1573 Redfield Ct
- 2651 Ophelia Ave
- 1042 Summermist Ct Unit 107
- 1050 Summermist Ct
- 1239 Simonson Way
- 1231 Simonson Way
- 1243 Simonson Way
- 1227 Simonson Way
- 1304 Sippola Way
- 1302 Sippola Way
- 1306 Sippola Way
- 1236 Simonson Way
- 1240 Simonson Way
- 1247 Simonson Way
- 1223 Simonson Way
- 1244 Simonson Way
- 1308 Sippola Way
- 2536 Loomis Ct
- 2529 Zachary Way
- 1224 Simonson Way
- 2532 Loomis Ct
- 1248 Simonson Way
- 1310 Sippola Way
- 1251 Simonson Ct
Your Personal Tour Guide
Ask me questions while you tour the home.