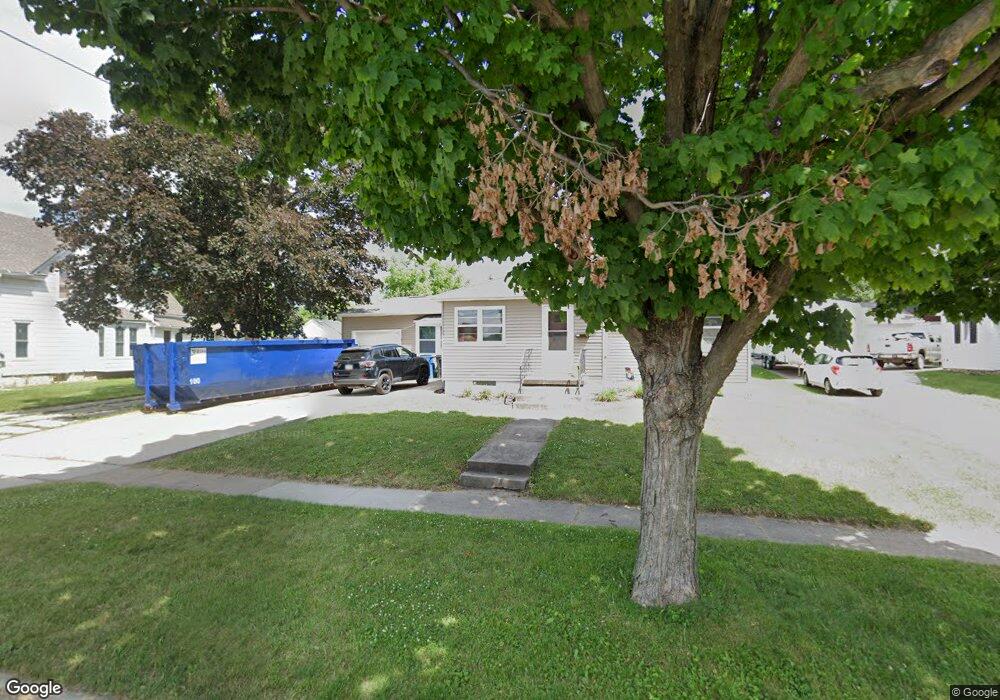
1235 W 19th St Cedar Falls, IA 50613
Estimated Value: $216,000 - $225,000
3
Beds
3
Baths
1,308
Sq Ft
$169/Sq Ft
Est. Value
About This Home
This home is located at 1235 W 19th St, Cedar Falls, IA 50613 and is currently estimated at $221,398, approximately $169 per square foot. 1235 W 19th St is a home located in Black Hawk County with nearby schools including Lincoln Elementary School, Holmes Junior High School, and Cedar Falls High School.
Ownership History
Date
Name
Owned For
Owner Type
Purchase Details
Closed on
Jun 20, 2024
Sold by
Prybil Wesley J and Prybil Michelle M
Bought by
Baumgartner Christian G and Baumgartner Greta J
Current Estimated Value
Home Financials for this Owner
Home Financials are based on the most recent Mortgage that was taken out on this home.
Original Mortgage
$42,000
Interest Rate
7.02%
Mortgage Type
New Conventional
Purchase Details
Closed on
Jul 19, 2005
Sold by
Hartleip Robert D and Hartleip Roselle V
Bought by
Sweeting Lawrence C
Home Financials for this Owner
Home Financials are based on the most recent Mortgage that was taken out on this home.
Original Mortgage
$99,680
Interest Rate
5.68%
Mortgage Type
New Conventional
Create a Home Valuation Report for This Property
The Home Valuation Report is an in-depth analysis detailing your home's value as well as a comparison with similar homes in the area
Home Values in the Area
Average Home Value in this Area
Purchase History
| Date | Buyer | Sale Price | Title Company |
|---|---|---|---|
| Baumgartner Christian G | $210,000 | None Listed On Document | |
| Sweeting Lawrence C | $125,000 | Title Services Corporation |
Source: Public Records
Mortgage History
| Date | Status | Borrower | Loan Amount |
|---|---|---|---|
| Closed | Baumgartner Christian G | $42,000 | |
| Open | Baumgartner Christian G | $157,500 | |
| Previous Owner | Sweeting Lawrence C | $99,680 |
Source: Public Records
Tax History Compared to Growth
Tax History
| Year | Tax Paid | Tax Assessment Tax Assessment Total Assessment is a certain percentage of the fair market value that is determined by local assessors to be the total taxable value of land and additions on the property. | Land | Improvement |
|---|---|---|---|---|
| 2025 | $3,048 | $213,720 | $50,590 | $163,130 |
| 2024 | $3,048 | $199,590 | $33,730 | $165,860 |
| 2023 | $3,300 | $199,590 | $33,730 | $165,860 |
| 2022 | $3,340 | $178,770 | $33,730 | $145,040 |
| 2021 | $2,838 | $178,770 | $33,730 | $145,040 |
| 2020 | $2,782 | $152,460 | $21,920 | $130,540 |
| 2019 | $2,782 | $152,460 | $21,920 | $130,540 |
| 2018 | $2,750 | $148,840 | $21,920 | $126,920 |
| 2017 | $2,810 | $148,840 | $21,920 | $126,920 |
| 2016 | $2,630 | $148,840 | $21,920 | $126,920 |
| 2015 | $2,630 | $148,840 | $21,920 | $126,920 |
| 2014 | $2,660 | $148,840 | $21,920 | $126,920 |
Source: Public Records
Map
Nearby Homes
- 1223 W 19th St
- 1710 College St
- 3726 Broomfield Dr
- 927 W 14th St
- 1221 Catherine St
- 1916 Shelden Ave
- 1125 W 12th St
- 1804 Tremont St
- 2503 Olive St
- 315 W 21st St
- 1709 Clay St
- 1321 Franklin St
- 514 W Seerley Blvd
- 2215 Franklin St
- 504 W Seerley Blvd
- 1316 Franklin St
- 915 W 9th St
- 406 W 12th St
- 8001 University Ave
- 2316 Franklin St