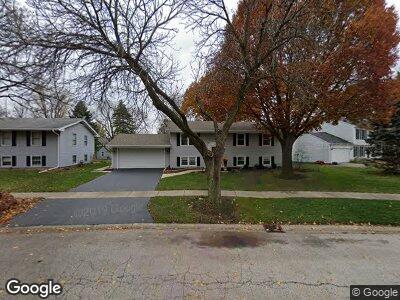
1236 S 11th St Unit 1 Saint Charles, IL 60174
Southwest Saint Charles NeighborhoodEstimated Value: $404,000 - $433,000
--
Bed
--
Bath
1,092
Sq Ft
$384/Sq Ft
Est. Value
About This Home
This home is located at 1236 S 11th St Unit 1, Saint Charles, IL 60174 and is currently estimated at $419,747, approximately $384 per square foot. 1236 S 11th St Unit 1 is a home located in Kane County with nearby schools including Davis Primary School, Richmond Intermediate School, and Thompson Middle School.
Ownership History
Date
Name
Owned For
Owner Type
Purchase Details
Closed on
Jun 3, 2024
Sold by
Rogers Scott and Rogers Jodie
Bought by
Taylor Robert E and Taylor Katherine B
Current Estimated Value
Home Financials for this Owner
Home Financials are based on the most recent Mortgage that was taken out on this home.
Original Mortgage
$336,000
Outstanding Balance
$335,156
Interest Rate
6.92%
Mortgage Type
New Conventional
Purchase Details
Closed on
Sep 25, 2003
Sold by
Roby Steven W
Bought by
Rogers Scott
Home Financials for this Owner
Home Financials are based on the most recent Mortgage that was taken out on this home.
Original Mortgage
$209,191
Interest Rate
6.33%
Mortgage Type
FHA
Create a Home Valuation Report for This Property
The Home Valuation Report is an in-depth analysis detailing your home's value as well as a comparison with similar homes in the area
Home Values in the Area
Average Home Value in this Area
Purchase History
| Date | Buyer | Sale Price | Title Company |
|---|---|---|---|
| Taylor Robert E | $420,000 | Old Republic Title | |
| Rogers Scott | $229,000 | Chicago Title Insurance Comp |
Source: Public Records
Mortgage History
| Date | Status | Borrower | Loan Amount |
|---|---|---|---|
| Open | Taylor Robert E | $336,000 | |
| Previous Owner | Rogers Scott | $139,000 | |
| Previous Owner | Rogers Scott | $180,000 | |
| Previous Owner | Rogers Scott | $22,400 | |
| Previous Owner | Rogers Scott | $196,000 | |
| Previous Owner | Rogers Scott | $206,700 | |
| Previous Owner | Rogers Scott | $209,191 | |
| Previous Owner | Roby Steven W | $196,960 | |
| Previous Owner | Roby Steven W | $20,304 | |
| Previous Owner | Roby Steven W | $197,011 | |
| Previous Owner | Roby Steven W | $16,013 | |
| Previous Owner | Roby Steven | $198,109 | |
| Previous Owner | Roby Steven W | $19,479 |
Source: Public Records
Tax History Compared to Growth
Tax History
| Year | Tax Paid | Tax Assessment Tax Assessment Total Assessment is a certain percentage of the fair market value that is determined by local assessors to be the total taxable value of land and additions on the property. | Land | Improvement |
|---|---|---|---|---|
| 2023 | $7,022 | $95,740 | $31,664 | $64,076 |
| 2022 | $6,745 | $89,543 | $32,095 | $57,448 |
| 2021 | $6,472 | $85,352 | $30,593 | $54,759 |
| 2020 | $6,402 | $83,789 | $30,023 | $53,766 |
| 2019 | $6,283 | $82,130 | $29,429 | $52,701 |
| 2018 | $6,065 | $79,126 | $28,310 | $50,816 |
| 2017 | $5,901 | $76,421 | $27,342 | $49,079 |
| 2016 | $6,188 | $73,737 | $26,381 | $47,356 |
| 2015 | -- | $69,882 | $26,097 | $43,785 |
| 2014 | -- | $67,053 | $26,097 | $40,956 |
| 2013 | -- | $69,128 | $26,358 | $42,770 |
Source: Public Records
Map
Nearby Homes
- 1301 S 10th St
- 1420 Marie St
- 526 Bradbury Ln Unit 526
- 529 Bradbury Ln Unit 529
- 416 S 10th Ct
- 1029 S 5th St
- 318 S 13th St
- 315 S 8th St
- 2218 Rockefeller Dr Unit 2218
- 1607 Oak St
- 1212 Center St
- 16 Mosedale St
- 629 N Lincoln Ave
- 800 Anderson Blvd
- 2262 Rockefeller Dr
- 335 Colonial Cir Unit 4
- 108 S 11th St
- 19 S 11th St
- 96 Mckinley St
- 82 Gray St
- 1236 S 11th St Unit 1
- 1242 S 11th St Unit 1
- 1230 S 11th St
- 1225 S 10th St
- 1219 S 10th St
- 1231 S 10th St
- 1224 S 11th St
- 1237 S 11th St
- 1213 S 10th St
- 1246 S 11th St
- 1231 S 11th St
- 1237 S 10th St
- 1225 S 11th St Unit 1
- 1218 S 11th St
- 1250 Fellows St
- 1254 Fellows St Unit 1
- 1207 S 10th St Unit 1
- 1243 S 10th St Unit 1
- 1219 S 11th St Unit 1
- 1260 Fellows St