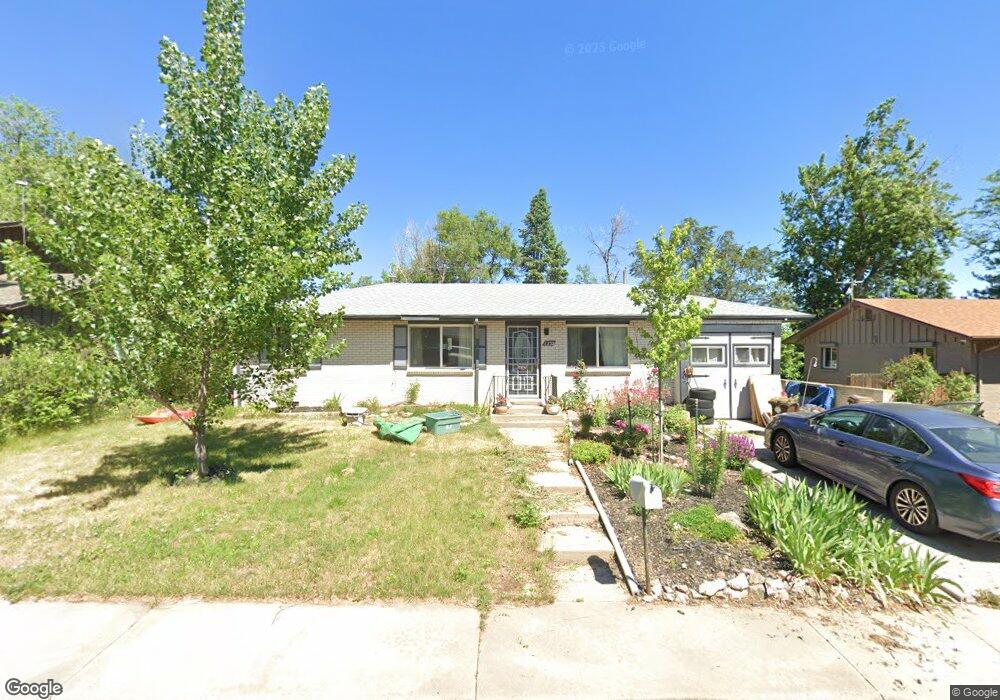
1237 Aikins Way Boulder, CO 80305
South Boulder NeighborhoodEstimated Value: $737,000 - $901,000
3
Beds
1
Bath
897
Sq Ft
$883/Sq Ft
Est. Value
About This Home
This home is located at 1237 Aikins Way, Boulder, CO 80305 and is currently estimated at $792,428, approximately $883 per square foot. 1237 Aikins Way is a home located in Boulder County with nearby schools including Creekside Elementary School, Southern Hills Middle School, and Fairview High School.
Ownership History
Date
Name
Owned For
Owner Type
Purchase Details
Closed on
Oct 30, 2014
Sold by
Tinsley Bryanna S and Tinsley Mansur P
Bought by
Tinsley Bryanna S
Current Estimated Value
Home Financials for this Owner
Home Financials are based on the most recent Mortgage that was taken out on this home.
Original Mortgage
$203,000
Outstanding Balance
$152,214
Interest Rate
3.75%
Mortgage Type
Adjustable Rate Mortgage/ARM
Estimated Equity
$640,214
Purchase Details
Closed on
Feb 28, 1995
Sold by
Colman William P
Bought by
Timbley Mansur P
Home Financials for this Owner
Home Financials are based on the most recent Mortgage that was taken out on this home.
Original Mortgage
$31,468
Interest Rate
9%
Purchase Details
Closed on
Oct 26, 1988
Bought by
Tinsley Mansur P
Purchase Details
Closed on
Sep 26, 1984
Bought by
Tinsley Mansur P
Purchase Details
Closed on
Sep 26, 1973
Bought by
Tinsley Mansur P
Create a Home Valuation Report for This Property
The Home Valuation Report is an in-depth analysis detailing your home's value as well as a comparison with similar homes in the area
Home Values in the Area
Average Home Value in this Area
Purchase History
| Date | Buyer | Sale Price | Title Company |
|---|---|---|---|
| Tinsley Bryanna S | -- | Mountain States Title | |
| Tinsley Bryanna S | $203,000 | Mountain States Title | |
| Timbley Mansur P | $140,500 | Land Title | |
| Tinsley Mansur P | $5,000 | -- | |
| Tinsley Mansur P | $81,500 | -- | |
| Tinsley Mansur P | -- | -- |
Source: Public Records
Mortgage History
| Date | Status | Borrower | Loan Amount |
|---|---|---|---|
| Open | Tinsley Bryanna S | $203,000 | |
| Previous Owner | Timbley Mansur P | $31,468 |
Source: Public Records
Tax History
| Year | Tax Paid | Tax Assessment Tax Assessment Total Assessment is a certain percentage of the fair market value that is determined by local assessors to be the total taxable value of land and additions on the property. | Land | Improvement |
|---|---|---|---|---|
| 2025 | $3,915 | $41,901 | $29,513 | $12,388 |
| 2024 | $3,915 | $41,901 | $29,513 | $12,388 |
| 2023 | $3,847 | $44,542 | $34,880 | $13,346 |
| 2022 | $3,477 | $37,439 | $25,965 | $11,474 |
| 2021 | $3,315 | $38,517 | $26,712 | $11,805 |
| 2020 | $3,290 | $37,795 | $25,240 | $12,555 |
| 2019 | $3,240 | $37,795 | $25,240 | $12,555 |
| 2018 | $3,019 | $34,819 | $23,256 | $11,563 |
| 2017 | $2,924 | $38,495 | $25,711 | $12,784 |
| 2016 | $2,747 | $31,729 | $16,159 | $15,570 |
| 2015 | $2,601 | $24,692 | $9,472 | $15,220 |
| 2014 | $2,076 | $24,692 | $9,472 | $15,220 |
Source: Public Records
Map
Nearby Homes
- 4630 MacKy Way
- 1516 Chambers Dr
- 4445 Grinnell Ave
- 4380 Ludlow St
- 4445 Squires Cir
- 1596 Bradley Dr Unit 105C
- 4286 Greenbriar Blvd
- 860 W Moorhead Cir Unit 2K
- 860 W Moorhead Cir Unit 1I
- 860 W Moorhead Cir Unit 2H
- 4204 Greenbriar Blvd Unit 45
- 800 W Moorhead Cir Unit E
- 750 W Moorhead Cir Unit A
- 725 S 45th St
- 4763 Tantra Dr Unit B
- 1720 S Marshall Rd Unit 41
- 1720 S Marshall Rd Unit 26
- 3970 Longwood Ave
- 3490 Emerson Ave
- 3450 Emerson Ave
- 1233 Aikins Way
- 1243 Aikins Way
- 4620 Ludlow St
- 4610 Ludlow St
- 4630 Ludlow St
- 1227 Aikins Way
- 1247 Aikins Way
- 1240 Aikins Way
- 1236 Aikins Way
- 4640 Ludlow St
- 4600 Ludlow St
- 1246 Aikins Way
- 0 Aikins Way
- 1230 Aikins Way
- 1223 Aikins Way
- 4650 Ludlow St
- 1226 Aikins Way
- 4605 MacKy Way
- 4615 MacKy Way
- 4615 Gordon Dr
Your Personal Tour Guide
Ask me questions while you tour the home.