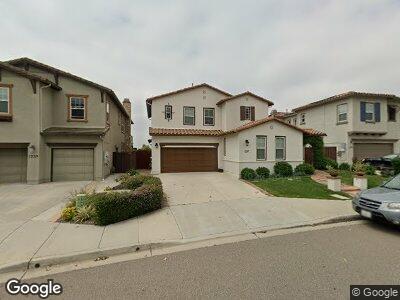
1237 Holmgrove Dr Unit 13 San Marcos, CA 92078
San Elijo NeighborhoodEstimated Value: $1,810,935 - $2,127,000
4
Beds
5
Baths
3,386
Sq Ft
$584/Sq Ft
Est. Value
About This Home
This home is located at 1237 Holmgrove Dr Unit 13, San Marcos, CA 92078 and is currently estimated at $1,976,984, approximately $583 per square foot. 1237 Holmgrove Dr Unit 13 is a home located in San Diego County with nearby schools including Double Peak School, San Marcos High School, and Baypoint Preparatory Academy - San Diego.
Ownership History
Date
Name
Owned For
Owner Type
Purchase Details
Closed on
Oct 23, 2013
Sold by
Peek Robert M and Peek Lisa M
Bought by
Peek Robert and Peek Lisa
Current Estimated Value
Home Financials for this Owner
Home Financials are based on the most recent Mortgage that was taken out on this home.
Original Mortgage
$660,000
Interest Rate
3.87%
Mortgage Type
Stand Alone Refi Refinance Of Original Loan
Purchase Details
Closed on
Sep 10, 2012
Sold by
Peek Robert M and Peek Lisa M
Bought by
Peek Robert and Peek Lisa
Purchase Details
Closed on
Aug 23, 2007
Sold by
Richmond American Homes Of California
Bought by
Peek Robert M and Peek Lisa M
Home Financials for this Owner
Home Financials are based on the most recent Mortgage that was taken out on this home.
Original Mortgage
$649,168
Interest Rate
6.61%
Mortgage Type
Purchase Money Mortgage
Create a Home Valuation Report for This Property
The Home Valuation Report is an in-depth analysis detailing your home's value as well as a comparison with similar homes in the area
Home Values in the Area
Average Home Value in this Area
Purchase History
| Date | Buyer | Sale Price | Title Company |
|---|---|---|---|
| Peek Robert | -- | Chicago Title Company | |
| Peek Robert | -- | None Available | |
| Peek Robert M | $811,500 | First American Title Co |
Source: Public Records
Mortgage History
| Date | Status | Borrower | Loan Amount |
|---|---|---|---|
| Open | Peek Robert | $553,000 | |
| Closed | Peek Robert | $660,000 | |
| Closed | Peek Robert M | $649,168 |
Source: Public Records
Tax History Compared to Growth
Tax History
| Year | Tax Paid | Tax Assessment Tax Assessment Total Assessment is a certain percentage of the fair market value that is determined by local assessors to be the total taxable value of land and additions on the property. | Land | Improvement |
|---|---|---|---|---|
| 2024 | $15,652 | $1,044,944 | $374,486 | $670,458 |
| 2023 | $15,652 | $1,024,456 | $367,144 | $657,312 |
| 2022 | $15,488 | $1,004,370 | $359,946 | $644,424 |
| 2021 | $15,117 | $984,678 | $352,889 | $631,789 |
| 2020 | $15,118 | $974,582 | $349,271 | $625,311 |
| 2019 | $14,978 | $955,473 | $342,423 | $613,050 |
| 2018 | $14,799 | $936,739 | $335,709 | $601,030 |
| 2017 | $14,538 | $918,373 | $329,127 | $589,246 |
| 2016 | $14,412 | $900,367 | $322,674 | $577,693 |
| 2015 | $14,240 | $886,844 | $317,828 | $569,016 |
| 2014 | $13,774 | $780,000 | $256,000 | $524,000 |
Source: Public Records
Map
Nearby Homes
- 1251 Holmgrove Dr
- 1407 Eclipse Dr
- 1087 Vega Way
- 1613 Reflection St
- 0 Questhaven Rd Unit NDP2501375
- 708 Costa Del Sur
- 788 Hollowbrook Ct Unit 27
- 543 Ledge St
- 940 Citrine Way
- 1208 Lexi Ct
- 1008 Brightwood Dr
- 977 Tucana Dr
- 0 Golden Eagle Trail Unit NDP2503140
- 0 Golden Eagle Trail Unit 240028011
- 1615 Trenton Way
- 1168 Westin Way
- 854 Genoa Way
- 1680 Trenton Way
- 1355 Sky Ridge Ct
- 1184 Highbluff Ave
- 1237 Holmgrove Dr Unit 13
- 1239 Holmgrove Dr
- 1235 Holmgrove Dr Unit 13
- 1241 Holmgrove Dr
- 1229 Holmgrove Dr Unit 13
- 1245 Holmgrove Dr Unit 11
- 1236 Holmgrove Dr
- 1234 Holmgrove Dr
- 1227 Holmgrove Dr
- 1238 Holmgrove Dr
- 1247 Holmgrove Dr
- 1240 Holmgrove Dr Unit 13
- 1225 Holmgrove Dr
- 1244 Holmgrove Dr Unit 13
- 1246 Holmgrove Dr
- 1221 Holmgrove Dr
- 1224 Holmgrove Dr Unit 13
- 1180 Festival Rd
- 1253 Holmgrove Dr
- 1248 Holmgrove Dr