1237 Pine Creek Way Unit C Concord, CA 94520
Princess Park NeighborhoodEstimated Value: $404,026 - $434,000
2
Beds
2
Baths
1,089
Sq Ft
$384/Sq Ft
Est. Value
About This Home
This home is located at 1237 Pine Creek Way Unit C, Concord, CA 94520 and is currently estimated at $418,507, approximately $384 per square foot. 1237 Pine Creek Way Unit C is a home located in Contra Costa County with nearby schools including Meadow Homes Elementary School, Oak Grove Middle School, and Mt. Diablo High School.
Ownership History
Date
Name
Owned For
Owner Type
Purchase Details
Closed on
Jan 28, 2020
Sold by
Cordice James C and Cordice Lillian B
Bought by
Cordice James and Cordice Corice Lillian
Current Estimated Value
Purchase Details
Closed on
Jun 7, 2017
Sold by
Stack Roylen
Bought by
Cordice James C and Cordice Lillian B
Home Financials for this Owner
Home Financials are based on the most recent Mortgage that was taken out on this home.
Original Mortgage
$300,700
Outstanding Balance
$250,120
Interest Rate
4.02%
Mortgage Type
New Conventional
Estimated Equity
$168,387
Purchase Details
Closed on
Aug 31, 2000
Sold by
Mckeon Lois G
Bought by
Stack Roylen
Home Financials for this Owner
Home Financials are based on the most recent Mortgage that was taken out on this home.
Original Mortgage
$112,800
Interest Rate
8.13%
Mortgage Type
Purchase Money Mortgage
Purchase Details
Closed on
Oct 6, 1993
Sold by
Mckeon Charles R and Mckeon Lois G
Bought by
Mckeon Charles R and Mckeon Lois G
Create a Home Valuation Report for This Property
The Home Valuation Report is an in-depth analysis detailing your home's value as well as a comparison with similar homes in the area
Home Values in the Area
Average Home Value in this Area
Purchase History
| Date | Buyer | Sale Price | Title Company |
|---|---|---|---|
| Cordice James | -- | None Available | |
| Cordice James C | $310,000 | Placer Title Company | |
| Stack Roylen | $141,000 | Chicago Title Co | |
| Mckeon Charles R | -- | -- |
Source: Public Records
Mortgage History
| Date | Status | Borrower | Loan Amount |
|---|---|---|---|
| Open | Cordice James C | $300,700 | |
| Previous Owner | Stack Roylen | $112,800 | |
| Closed | Stack Roylen | $21,150 |
Source: Public Records
Tax History
| Year | Tax Paid | Tax Assessment Tax Assessment Total Assessment is a certain percentage of the fair market value that is determined by local assessors to be the total taxable value of land and additions on the property. | Land | Improvement |
|---|---|---|---|---|
| 2025 | $4,819 | $359,775 | $238,265 | $121,510 |
| 2024 | $4,580 | $352,722 | $233,594 | $119,128 |
| 2023 | $4,580 | $345,807 | $229,014 | $116,793 |
| 2022 | $4,502 | $339,027 | $224,524 | $114,503 |
| 2021 | $4,379 | $332,380 | $220,122 | $112,258 |
| 2019 | $4,282 | $322,523 | $213,594 | $108,929 |
| 2018 | $4,109 | $316,200 | $209,406 | $106,794 |
| 2017 | $2,624 | $183,050 | $32,449 | $150,601 |
| 2016 | $2,525 | $179,462 | $31,813 | $147,649 |
| 2015 | $2,467 | $176,768 | $31,336 | $145,432 |
| 2014 | $2,397 | $173,307 | $30,723 | $142,584 |
Source: Public Records
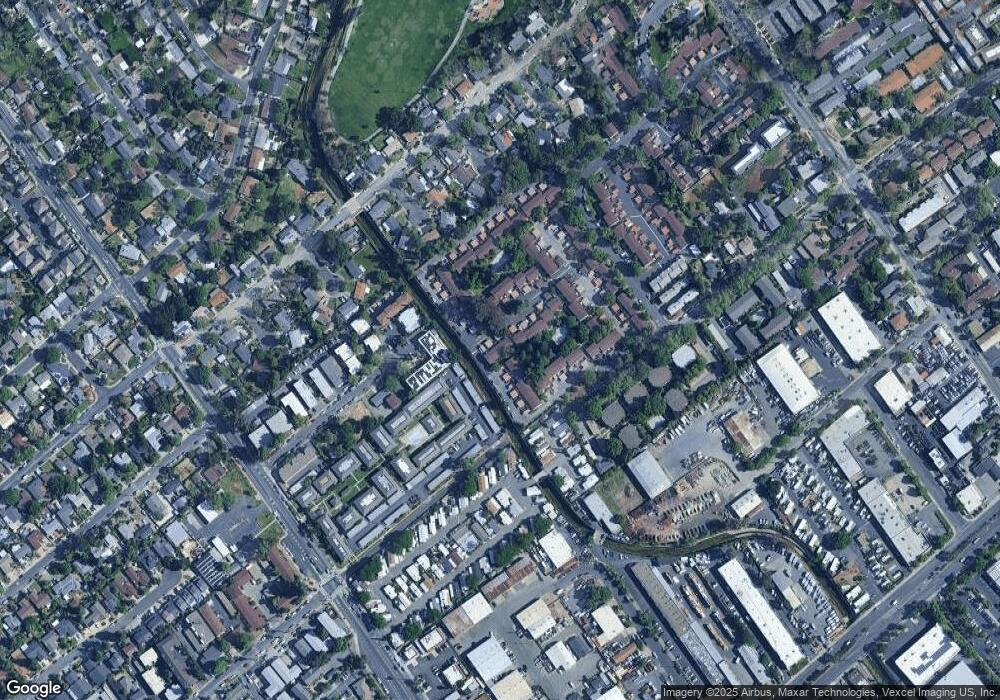
Map
Nearby Homes
- 1245 Pine Creek Way Unit I
- 1237 Pine Creek Way Unit A
- 2321 Sunshine Dr
- 1990 Sunshine Dr
- 1260 Meadow Ln
- 1133 Meadow Ln Unit 106
- 1133 Meadow Ln Unit 53
- 2542 Camara Cir
- 2561 Camara Cir
- 2548 Camara Cir
- 1841 Mayette Ave
- 1660 Laguna St Unit D
- 1154 Tilson Dr
- 1699 Laguna St Unit 302
- 1699 Laguna St Unit 311
- 1060 Oak Grove Rd Unit 37
- 1577 Waltham Rd
- 1408 Carmelita Ct
- 2045 Sierra Rd Unit 2
- 1800 Laguna St Unit 5
- 1237 Pine Creek Way
- 1237 Pine Creek Way Unit D
- 1237 Pine Creek Way Unit E
- 1211 Pine Creek Way Unit A
- 1211 Pine Creek Way Unit B
- 1211 Pine Creek Way Unit C
- 1211 Pine Creek Way Unit D
- 1211 Pine Creek Way Unit E
- 1211 Pine Creek Way Unit F
- 1211 Pine Creek Way Unit G
- 1211 Pine Creek Way Unit H
- 1211 Pine Creek Way Unit I
- 1247 Pine Creek Way Unit D
- 1247 Pine Creek Way Unit C
- 1247 Pine Creek Way Unit B
- 1247 Pine Creek Way Unit A
- 1255 Pine Creek Way Unit H
- 1255 Pine Creek Way Unit G
- 1255 Pine Creek Way Unit F
- 1255 Pine Creek Way Unit E
Your Personal Tour Guide
Ask me questions while you tour the home.