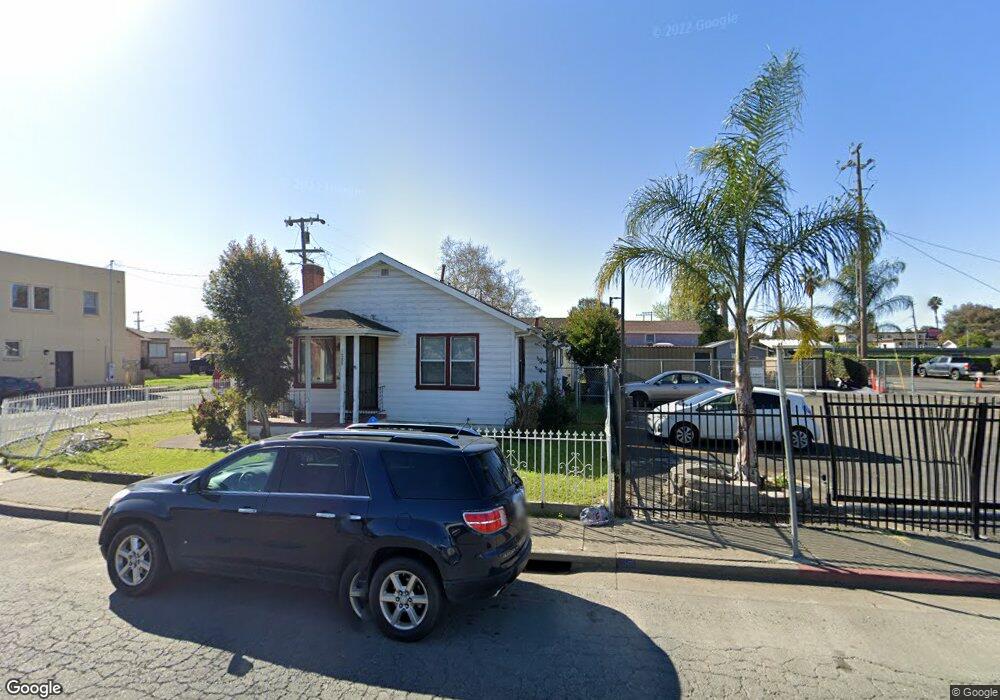
1237 Springs Rd Vallejo, CA 94591
Estimated Value: $391,559 - $433,000
2
Beds
1
Bath
1,008
Sq Ft
$411/Sq Ft
Est. Value
About This Home
This home is located at 1237 Springs Rd, Vallejo, CA 94591 and is currently estimated at $413,890, approximately $410 per square foot. 1237 Springs Rd is a home located in Solano County with nearby schools including Steffan Manor Elementary, Hogan Middle School, and Jesse M. Bethel High School.
Ownership History
Date
Name
Owned For
Owner Type
Purchase Details
Closed on
Nov 24, 2015
Sold by
Johnson Ralph Edward
Bought by
Johnson Ii Ralph Edward
Current Estimated Value
Purchase Details
Closed on
Mar 12, 2010
Sold by
Thompson Mellonee Y
Bought by
The Mellonee Y Thompson Revocable Trust and Thompson Mellonee Y
Purchase Details
Closed on
Aug 27, 2007
Sold by
Thompson Mellonee Y
Bought by
Thompson Mellonee Y
Purchase Details
Closed on
Jan 30, 2006
Sold by
Williams Verna B
Bought by
Williams Verna B
Create a Home Valuation Report for This Property
The Home Valuation Report is an in-depth analysis detailing your home's value as well as a comparison with similar homes in the area
Purchase History
| Date | Buyer | Sale Price | Title Company |
|---|---|---|---|
| Johnson Ii Ralph Edward | -- | None Available | |
| The Mellonee Y Thompson Revocable Trust | -- | None Available | |
| Thompson Mellonee Y | -- | None Available | |
| Williams Verna B | -- | None Available |
Source: Public Records
Tax History
| Year | Tax Paid | Tax Assessment Tax Assessment Total Assessment is a certain percentage of the fair market value that is determined by local assessors to be the total taxable value of land and additions on the property. | Land | Improvement |
|---|---|---|---|---|
| 2025 | $3,663 | $228,343 | $60,089 | $168,254 |
| 2024 | $3,663 | $223,866 | $58,911 | $164,955 |
| 2023 | $3,433 | $219,477 | $57,756 | $161,721 |
| 2022 | $3,334 | $215,174 | $56,624 | $158,550 |
| 2021 | $3,259 | $210,956 | $55,514 | $155,442 |
| 2020 | $3,265 | $208,794 | $54,945 | $153,849 |
| 2019 | $3,158 | $204,701 | $53,868 | $150,833 |
| 2018 | $2,951 | $200,688 | $52,812 | $147,876 |
| 2017 | $2,811 | $196,754 | $51,777 | $144,977 |
| 2016 | $2,241 | $192,897 | $50,762 | $142,135 |
| 2015 | $2,212 | $190,000 | $50,000 | $140,000 |
| 2014 | $644 | $52,021 | $20,288 | $31,733 |
Source: Public Records
Map
Nearby Homes
- 1009 Glenwood St
- 725 Del Norte St
- 431 Hilton Ave
- 20 Chesley Ct
- 430 Warford Ave
- 333 14th St
- 51 Mendocino St
- 242 Phelan Ave
- 2751 Georgia St
- 216 Manhattan Dr
- 712 Laurel St
- 104 Foster St
- 1930 L Ellenburg St
- 108 Revere St
- 300 Concord St
- 129 Revere St
- 313 Roney Ave
- 624 Laurel St
- 215 Roney Ave
- 2019 Georgia St
Your Personal Tour Guide
Ask me questions while you tour the home.