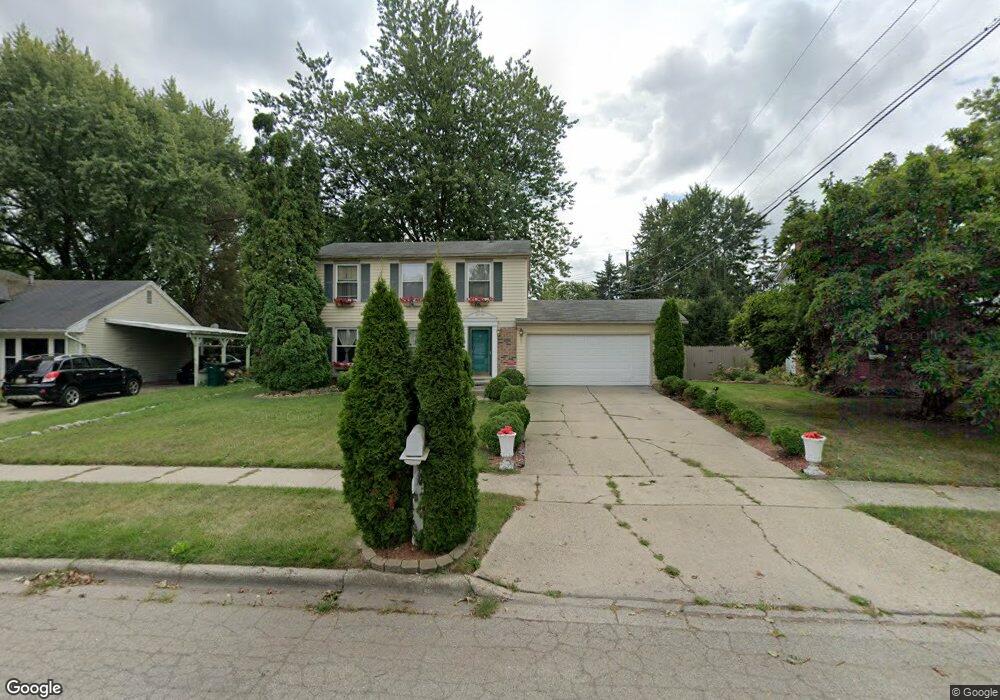
1237 W Northrup St Lansing, MI 48911
Southern Lansing NeighborhoodEstimated Value: $170,000 - $206,447
4
Beds
2
Baths
1,485
Sq Ft
$132/Sq Ft
Est. Value
About This Home
This home is located at 1237 W Northrup St, Lansing, MI 48911 and is currently estimated at $195,362, approximately $131 per square foot. 1237 W Northrup St is a home located in Ingham County with nearby schools including Reo Elementary School, Attwood School, and Everett High School.
Ownership History
Date
Name
Owned For
Owner Type
Purchase Details
Closed on
Jun 20, 2003
Sold by
Render Terance R and Render Terri A
Bought by
Scruggs Anthony T and Scruggs Vanessa R
Current Estimated Value
Home Financials for this Owner
Home Financials are based on the most recent Mortgage that was taken out on this home.
Original Mortgage
$136,000
Outstanding Balance
$57,756
Interest Rate
5.36%
Mortgage Type
VA
Estimated Equity
$137,606
Purchase Details
Closed on
Sep 22, 2000
Sold by
Garza Rolando and Garza Olga
Bought by
Render Terance R and Render Terri A
Home Financials for this Owner
Home Financials are based on the most recent Mortgage that was taken out on this home.
Original Mortgage
$109,000
Interest Rate
7.96%
Mortgage Type
FHA
Purchase Details
Closed on
Mar 1, 1993
Create a Home Valuation Report for This Property
The Home Valuation Report is an in-depth analysis detailing your home's value as well as a comparison with similar homes in the area
Home Values in the Area
Average Home Value in this Area
Purchase History
| Date | Buyer | Sale Price | Title Company |
|---|---|---|---|
| Scruggs Anthony T | $136,000 | Transnation | |
| Render Terance R | $109,100 | Midstate Title Company | |
| -- | $53,000 | -- |
Source: Public Records
Mortgage History
| Date | Status | Borrower | Loan Amount |
|---|---|---|---|
| Open | Scruggs Anthony T | $136,000 | |
| Previous Owner | Render Terance R | $109,000 |
Source: Public Records
Tax History Compared to Growth
Tax History
| Year | Tax Paid | Tax Assessment Tax Assessment Total Assessment is a certain percentage of the fair market value that is determined by local assessors to be the total taxable value of land and additions on the property. | Land | Improvement |
|---|---|---|---|---|
| 2025 | $3,476 | $98,700 | $8,700 | $90,000 |
| 2024 | $28 | $82,400 | $8,700 | $73,700 |
| 2023 | $3,258 | $75,200 | $8,700 | $66,500 |
| 2022 | $2,936 | $65,700 | $8,000 | $57,700 |
| 2021 | $2,875 | $64,200 | $6,600 | $57,600 |
| 2020 | $2,858 | $62,700 | $6,600 | $56,100 |
| 2019 | $2,740 | $54,800 | $6,600 | $48,200 |
| 2018 | $2,567 | $51,200 | $6,600 | $44,600 |
| 2017 | $2,458 | $51,200 | $6,600 | $44,600 |
| 2016 | $2,350 | $47,100 | $6,600 | $40,500 |
| 2015 | $2,350 | $45,600 | $13,138 | $32,462 |
| 2014 | $2,350 | $41,900 | $19,707 | $22,193 |
Source: Public Records
Map
Nearby Homes
- 1014 W Northrup St
- 5750 Ashley Dr
- 1020 R G Curtiss Ave
- 5838 S Martin Luther King Junior Blvd
- 6037 Hughes Rd
- 0 W Jolly Rd
- 1119 W Miller Rd
- 5026 Delray Dr Unit A
- 0 Midwood St
- 4916 Tressa Dr
- 5006 Delbrook Ave
- 2045 Moffitt St
- 4935 Delray Dr
- 1324 N Briarfield Dr
- 5902 Hilliard Rd
- 5636 Ellendale Dr
- 833 Dornell Ave
- 1415 Reo Rd
- 6030 Piper Ave
- 6270 S Washington Ave
- 1233 W Northrup St
- 1241 W Northrup St
- 1328 Mark Twain Dr
- 1225 W Northrup St
- 1322 Mark Twain Dr
- 1301 Penrod Ct
- 1332 Mark Twain Dr
- 1316 Mark Twain Dr
- 1217 W Northrup St
- 1236 W Northrup St
- 1400 Mark Twain Dr
- 1242 W Northrup St
- 1230 W Northrup St
- 1310 Mark Twain Dr
- 1213 W Northrup St
- 1250 W Northrup St
- 1224 W Northrup St
- 1315 Penrod Ct
- 1408 Mark Twain Dr
- 1329 Mark Twain Dr