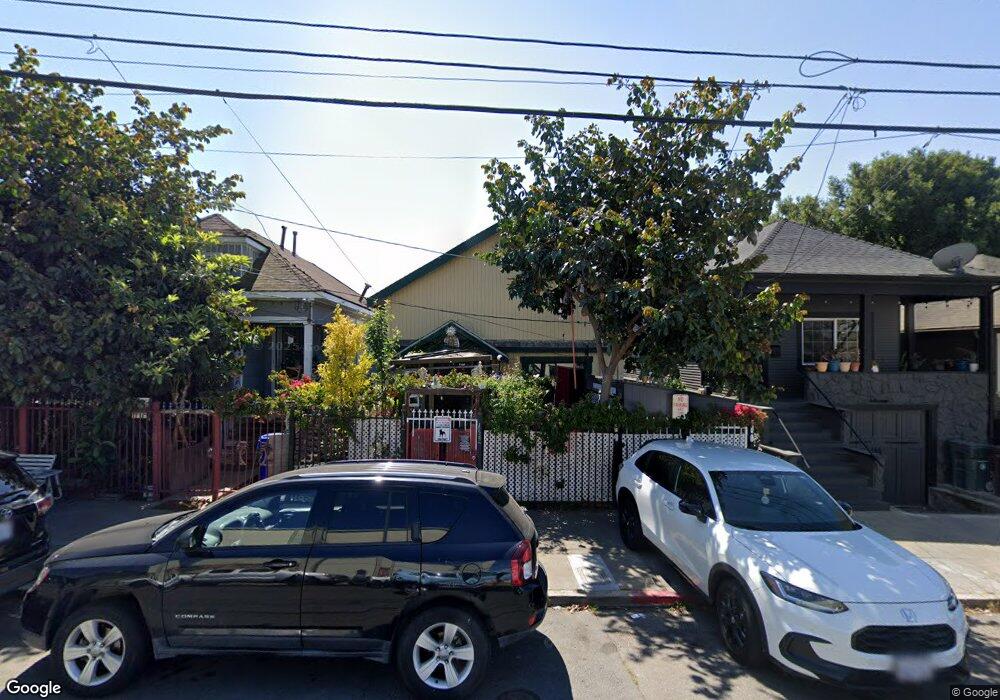
1238 53rd Ave Oakland, CA 94601
Melrose NeighborhoodEstimated Value: $388,000 - $449,000
About This Home
This home is located at 1238 53rd Ave, Oakland, CA 94601 and is currently estimated at $424,865, approximately $544 per square foot. 1238 53rd Ave is a home located in Alameda County with nearby schools including Bridges Academy Elementary School, Greenleaf Elementary School, and Fremont High School.
Ownership History
We collect this data history from publicly available records. To have your information removed, we recommend requesting removal directly through your county’s website.
Purchase Details
Home Values in the Area
Average Home Value in this Area
Purchase History
We collect this data history from publicly available records. To have your information removed, we recommend requesting removal directly through your county’s website.
| Date | Buyer | Sale Price | Title Company |
|---|---|---|---|
| $121,000 | Nortwestern Title Company |
Mortgage History
We collect this data history from publicly available records. To have your information removed, we recommend requesting removal directly through your county’s website.
| Date | Status | Borrower | Loan Amount |
|---|---|---|---|
| Open | $50,000 | ||
| Open | $256,000 | ||
| Closed | $50,000 | ||
| Closed | $170,000 |
Tax History
We collect this data history from publicly available records. To have your information removed, we recommend requesting removal directly through your county’s website.
| Year | Tax Paid | Tax Assessment Tax Assessment Total Assessment is a certain percentage of the fair market value that is determined by local assessors to be the total taxable value of land and additions on the property. | Land | Improvement |
|---|---|---|---|---|
| 2025 | $4,104 | $182,681 | $56,904 | $132,777 |
| 2024 | $4,104 | $178,963 | $55,789 | $130,174 |
| 2023 | $4,203 | $182,317 | $54,695 | $127,622 |
| 2022 | $4,033 | $171,743 | $53,623 | $125,120 |
| 2021 | $3,728 | $168,238 | $52,571 | $122,667 |
| 2020 | $3,684 | $173,441 | $52,032 | $121,409 |
| 2019 | $3,465 | $170,041 | $51,012 | $119,029 |
| 2018 | $3,395 | $166,708 | $50,012 | $116,696 |
| 2017 | $3,234 | $163,440 | $49,032 | $114,408 |
| 2016 | $3,050 | $160,236 | $48,071 | $112,165 |
| 2015 | $3,029 | $157,828 | $47,348 | $110,480 |
| 2014 | $2,970 | $154,737 | $46,421 | $108,316 |
Map
- 1436 52nd Ave
- 1447 53rd Ave
- 1024 50th Ave
- 1515 54th Ave
- 1517 51st Ave
- 1519 48th Ave
- 1137 Seminary Ave
- 1181 60th Ave
- 1605 57th Ave
- 1914 51st Ave
- 1432 45th Ave
- 1919 48th Ave
- 5917 International Blvd
- 1826 Vicksburg Ave Unit 1
- 1720 46th Ave
- 1130 61st Ave
- 1118 61st Ave
- 5129 Ygnacio Ave
- 1201 62nd Ave
- 1363 61st Ave
Ask me questions while you tour the home.