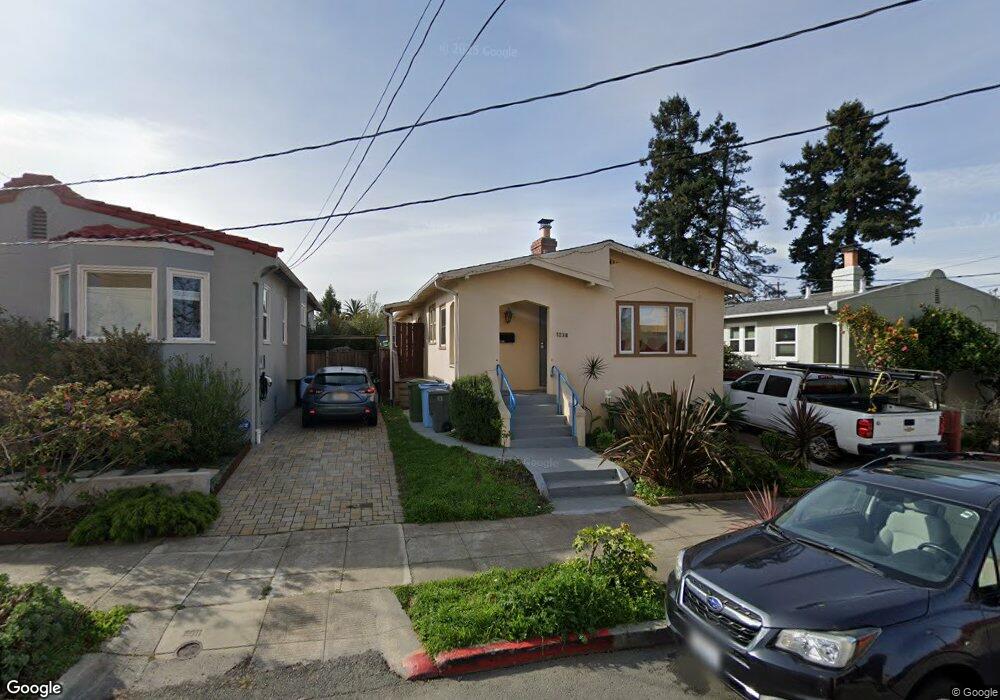
1238 Addison St Berkeley, CA 94702
West Berkeley NeighborhoodEstimated Value: $1,216,000 - $1,311,077
2
Beds
1
Bath
1,001
Sq Ft
$1,256/Sq Ft
Est. Value
About This Home
This home is located at 1238 Addison St, Berkeley, CA 94702 and is currently estimated at $1,257,519, approximately $1,256 per square foot. 1238 Addison St is a home located in Alameda County with nearby schools including Rosa Parks Elementary School, Ruth Acty Elementary, and Berkeley Arts Magnet at Whittier School.
Ownership History
Date
Name
Owned For
Owner Type
Purchase Details
Closed on
Apr 28, 2017
Sold by
Wrigley Amy L and Langenstein Amy L
Bought by
Wrigley Amy and Amy Wrigley Inter Vivos Trust
Current Estimated Value
Purchase Details
Closed on
Aug 14, 2012
Sold by
Pellinen Seija and Pellinen Jarmo
Bought by
Langenstein Amy L
Home Financials for this Owner
Home Financials are based on the most recent Mortgage that was taken out on this home.
Original Mortgage
$377,000
Outstanding Balance
$259,813
Interest Rate
3.56%
Mortgage Type
New Conventional
Estimated Equity
$997,706
Purchase Details
Closed on
Jul 5, 2012
Sold by
Pellinen Seija and Pellinen Jarmo
Bought by
Pellinen Seija and Pellinen Jarmo
Home Financials for this Owner
Home Financials are based on the most recent Mortgage that was taken out on this home.
Original Mortgage
$377,000
Outstanding Balance
$259,813
Interest Rate
3.56%
Mortgage Type
New Conventional
Estimated Equity
$997,706
Purchase Details
Closed on
Nov 17, 1999
Sold by
Pellinen Maija L
Bought by
Pellinen Maija Liisa and Maija Liisa Pellinen 1999 Trus
Create a Home Valuation Report for This Property
The Home Valuation Report is an in-depth analysis detailing your home's value as well as a comparison with similar homes in the area
Home Values in the Area
Average Home Value in this Area
Purchase History
| Date | Buyer | Sale Price | Title Company |
|---|---|---|---|
| Wrigley Amy | -- | None Available | |
| Langenstein Amy L | $452,000 | Chicago Title Company | |
| Pellinen Seija | -- | None Available | |
| Pellinen Maija Liisa | -- | -- |
Source: Public Records
Mortgage History
| Date | Status | Borrower | Loan Amount |
|---|---|---|---|
| Open | Langenstein Amy L | $377,000 |
Source: Public Records
Tax History
| Year | Tax Paid | Tax Assessment Tax Assessment Total Assessment is a certain percentage of the fair market value that is determined by local assessors to be the total taxable value of land and additions on the property. | Land | Improvement |
|---|---|---|---|---|
| 2025 | $10,912 | $651,140 | $166,975 | $491,165 |
| 2024 | $10,912 | $638,238 | $163,701 | $481,537 |
| 2023 | $10,623 | $632,587 | $160,492 | $472,095 |
| 2022 | $10,114 | $592,487 | $157,346 | $442,141 |
| 2021 | $10,251 | $557,403 | $154,261 | $410,142 |
| 2020 | $8,314 | $508,933 | $152,680 | $356,253 |
| 2019 | $8,016 | $498,957 | $149,687 | $349,270 |
| 2018 | $7,869 | $489,176 | $146,753 | $342,423 |
| 2017 | $7,577 | $479,584 | $143,875 | $335,709 |
| 2016 | $7,335 | $470,183 | $141,055 | $329,128 |
| 2015 | $7,230 | $463,123 | $138,937 | $324,186 |
| 2014 | $7,171 | $454,051 | $136,215 | $317,836 |
Source: Public Records
Map
Nearby Homes
- 2144 Curtis St
- 1919 Curtis St
- 1261 Hearst Ave
- 2231 Byron St
- 1128 Delaware St
- 2324 Browning St
- 1411 Hearst Ave Unit 2
- 1728 Curtis St
- 2013 9th St
- 2241 Ninth St
- 1322 Virginia St
- 2327 10th St Unit 4
- 1039 Channing Way
- 1813 Sacramento St
- 2118 California St
- 1578 Allston Way
- 1631 Belvedere Ave
- 931 Bancroft Way
- 940 Delaware St
- 1050 Allston Way
- 1242 Addison St
- 1234 Addison St
- 2110 Bonar St
- 1246 Addison St
- 2112 Bonar St
- 2109 Browning St
- 2105 Browning St
- 2101 Browning St
- 2115 Browning St
- 2120 Bonar St
- 2123 Browning St
- 1250 Addison St Unit 213
- 1250 Addison St Unit 204
- 2121 Browning St
- 2093 Bonar St
- 2124 Bonar St
- 2081 Bonar St
- 2125 Browning St
- 2069 Bonar St
- 1259 Addison St
Your Personal Tour Guide
Ask me questions while you tour the home.