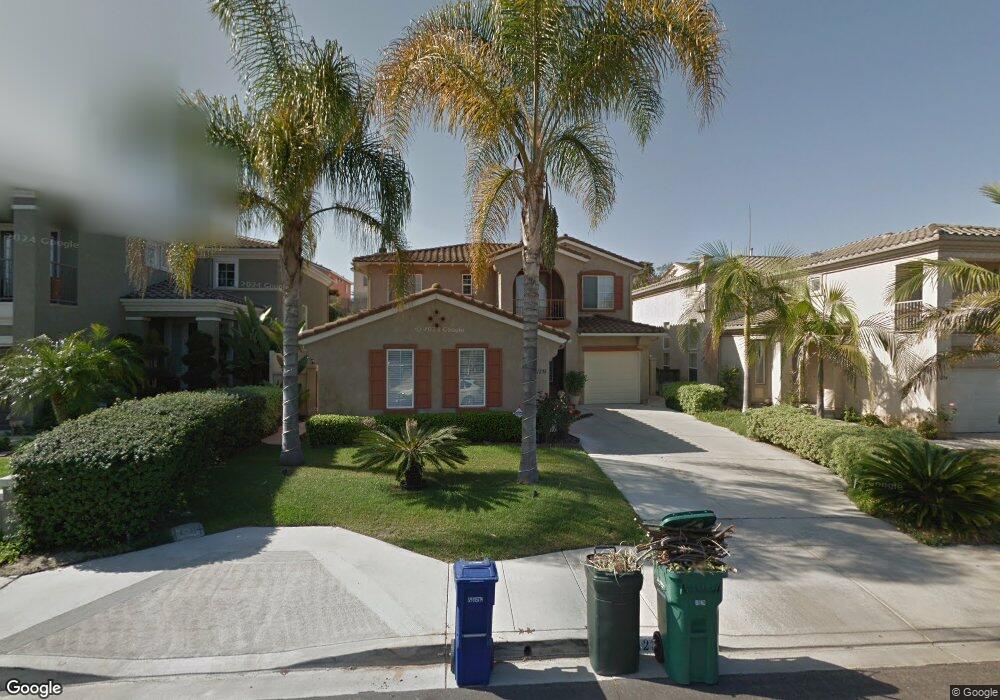
1238 Via Escalante Chula Vista, CA 91910
Rancho Del Rey NeighborhoodEstimated Value: $1,089,543 - $1,202,000
4
Beds
3
Baths
2,671
Sq Ft
$430/Sq Ft
Est. Value
About This Home
This home is located at 1238 Via Escalante, Chula Vista, CA 91910 and is currently estimated at $1,147,636, approximately $429 per square foot. 1238 Via Escalante is a home located in San Diego County with nearby schools including Chula Vista Hills Elementary School, Rancho Del Rey Middle School, and Otay Ranch Senior High School.
Ownership History
Date
Name
Owned For
Owner Type
Purchase Details
Closed on
Aug 3, 2017
Sold by
Avila Armando U and Uribe Patricia M
Bought by
Uribe Armando and Uribe Patricia Elena
Current Estimated Value
Purchase Details
Closed on
Dec 1, 2000
Sold by
Carson Daniel G and Carson Maria G
Bought by
Avila Armando Uribe and Uribe Patricia M
Home Financials for this Owner
Home Financials are based on the most recent Mortgage that was taken out on this home.
Original Mortgage
$244,000
Outstanding Balance
$88,621
Interest Rate
7.5%
Estimated Equity
$1,059,015
Purchase Details
Closed on
May 4, 1994
Sold by
Udc Homes Inc
Bought by
Carson Daniel G and Carson Maria G
Home Financials for this Owner
Home Financials are based on the most recent Mortgage that was taken out on this home.
Original Mortgage
$241,100
Interest Rate
7.17%
Create a Home Valuation Report for This Property
The Home Valuation Report is an in-depth analysis detailing your home's value as well as a comparison with similar homes in the area
Home Values in the Area
Average Home Value in this Area
Purchase History
| Date | Buyer | Sale Price | Title Company |
|---|---|---|---|
| Uribe Armando | -- | None Available | |
| Avila Armando Uribe | $344,000 | First American Title Ins Co | |
| Carson Daniel G | $254,000 | First American Title |
Source: Public Records
Mortgage History
| Date | Status | Borrower | Loan Amount |
|---|---|---|---|
| Open | Avila Armando Uribe | $244,000 | |
| Previous Owner | Carson Daniel G | $241,100 |
Source: Public Records
Tax History Compared to Growth
Tax History
| Year | Tax Paid | Tax Assessment Tax Assessment Total Assessment is a certain percentage of the fair market value that is determined by local assessors to be the total taxable value of land and additions on the property. | Land | Improvement |
|---|---|---|---|---|
| 2025 | $6,090 | $518,329 | $153,140 | $365,189 |
| 2024 | $6,090 | $508,167 | $150,138 | $358,029 |
| 2023 | $5,984 | $498,204 | $147,195 | $351,009 |
| 2022 | $7,797 | $488,436 | $144,309 | $344,127 |
| 2021 | $7,617 | $478,860 | $141,480 | $337,380 |
| 2020 | $7,436 | $473,951 | $140,030 | $333,921 |
| 2019 | $7,248 | $464,659 | $137,285 | $327,374 |
| 2018 | $7,114 | $455,549 | $134,594 | $320,955 |
| 2017 | $6,982 | $446,617 | $131,955 | $314,662 |
| 2016 | $6,785 | $437,861 | $129,368 | $308,493 |
| 2015 | $6,676 | $431,285 | $127,425 | $303,860 |
| 2014 | $6,548 | $422,837 | $124,929 | $297,908 |
Source: Public Records
Map
Nearby Homes
- 1181 De Soto Ct Unit 54
- 1236 El Cortez Ct
- 1075 Hayuco Plaza
- 1112 Camino Del Rey
- 1060 Via Sinuoso
- 1057 Paseo Del Norte
- 1209 Morgan Hill Dr
- 1386 Serena Cir Unit 2
- 1402 Antioch Ave
- 1284 Saint Helena Ave
- 1415 Summit Dr
- 1340 Monte Sereno Ave
- 1175 Santa Olivia Rd
- 1236 Bolinas Bay Ct
- 1529 Apache Dr Unit A
- 1029 Vista Oak Place
- 1532 Apache Dr Unit D
- 1370 Callejon Palacios Unit 61
- 728 Cardona Ave
- 1377 Stoney Spring Ct
- 1234 Via Escalante
- 1242 Via Escalante
- 1246 Via Escalante
- 1230 Via Escalante
- 1082 Via Miraleste
- 1086 Via Miraleste
- 1080 Via Miraleste
- 1090 Via Miraleste
- 1076 Via Miraleste
- 1226 Via Escalante
- 1250 Via Escalante
- 1094 Via Miraleste
- 1010 Plaza Vista Mar
- 1072 Via Miraleste
- 1098 Via Miraleste
- 1245 Via Escalante
- 1007 Plaza Gardenia
- 1222 Via Escalante
- 1254 Via Escalante
- 1008 Plaza Vista Mar