Estimated Value: $713,819 - $776,000
3
Beds
2
Baths
1,621
Sq Ft
$456/Sq Ft
Est. Value
About This Home
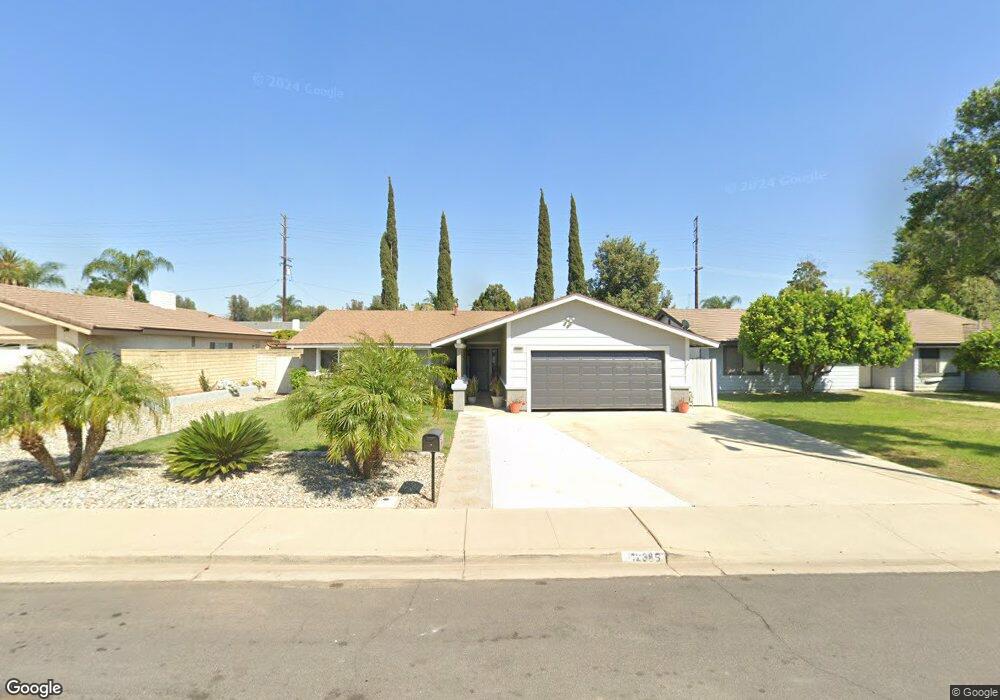
This home is located at 12385 Baca Ave, Chino, CA 91710 and is currently estimated at $739,205, approximately $456 per square foot. 12385 Baca Ave is a home located in San Bernardino County with nearby schools including Newman Elementary, Ramona Junior High School, and Don Antonio Lugo High School.
Ownership History
Date
Name
Owned For
Owner Type
Purchase Details
Closed on
Feb 26, 2008
Sold by
Mallard Tony M
Bought by
Mallard Tony M and Mallard Tina M
Current Estimated Value
Home Financials for this Owner
Home Financials are based on the most recent Mortgage that was taken out on this home.
Original Mortgage
$240,500
Outstanding Balance
$149,103
Interest Rate
5.65%
Mortgage Type
New Conventional
Estimated Equity
$590,102
Purchase Details
Closed on
Jun 10, 1997
Sold by
Federal National Mortgage Association
Bought by
Mallard Tony and Mallard Tina
Home Financials for this Owner
Home Financials are based on the most recent Mortgage that was taken out on this home.
Original Mortgage
$101,600
Interest Rate
7.92%
Purchase Details
Closed on
Mar 21, 1997
Sold by
Nationsbanc Mtg Corp
Bought by
Federal National Mortgage Association
Create a Home Valuation Report for This Property
The Home Valuation Report is an in-depth analysis detailing your home's value as well as a comparison with similar homes in the area
Home Values in the Area
Average Home Value in this Area
Purchase History
| Date | Buyer | Sale Price | Title Company |
|---|---|---|---|
| Mallard Tony M | -- | Accommodation | |
| Mallard Tony M | -- | Equity Title Company | |
| Mallard Tony | $127,000 | Fidelity National Title Co | |
| Federal National Mortgage Association | -- | Old Republic Title Company | |
| Nationsbanc Mtg Corp | $135,000 | Old Republic Title Company |
Source: Public Records
Mortgage History
| Date | Status | Borrower | Loan Amount |
|---|---|---|---|
| Open | Mallard Tony M | $240,500 | |
| Closed | Mallard Tony | $101,600 |
Source: Public Records
Tax History
| Year | Tax Paid | Tax Assessment Tax Assessment Total Assessment is a certain percentage of the fair market value that is determined by local assessors to be the total taxable value of land and additions on the property. | Land | Improvement |
|---|---|---|---|---|
| 2025 | $2,202 | $202,787 | $60,678 | $142,109 |
| 2024 | $2,142 | $198,811 | $59,488 | $139,323 |
| 2023 | $2,082 | $194,913 | $58,322 | $136,591 |
| 2022 | $2,068 | $191,091 | $57,178 | $133,913 |
| 2021 | $2,026 | $187,344 | $56,057 | $131,287 |
| 2020 | $1,999 | $185,423 | $55,482 | $129,941 |
| 2019 | $1,963 | $181,787 | $54,394 | $127,393 |
| 2018 | $1,919 | $178,222 | $53,327 | $124,895 |
| 2017 | $1,883 | $174,727 | $52,281 | $122,446 |
| 2016 | $1,759 | $171,301 | $51,256 | $120,045 |
| 2015 | $1,723 | $168,728 | $50,486 | $118,242 |
| 2014 | $1,688 | $165,423 | $49,497 | $115,926 |
Source: Public Records
Map
Nearby Homes
- 5195 Walnut Ave Unit 14
- 5039 Tyler St
- 12488 Monte Vista Ave
- 4836 Terry Ave
- 12124 Lester Ct
- 4965 Independence St
- 12585 Yorba Ave
- 12629 Thomas Place
- 12620 Anthony Place
- 11910 Carlisle Ave
- 4610 Philadelphia St
- 12931 4th St
- 11938 Vista Ave
- 12608 Ramona Ave
- 5062 Taft St
- 11873 Seneca Way
- 11748 Monte Vista Ave
- 12346 Cedar Ave
- 11818 Yorba Ave
- 13085 5th St
- 12365 Baca Ave
- 12395 Baca Ave
- 12380 Telephone Ave
- 12355 Baca Ave
- 12360 Telephone Ave
- 12394 Telephone Ave
- 12405 Baca Ave
- 12350 Telephone Ave
- 12370 Baca Ave
- 12380 Baca Ave
- 12345 Baca Ave
- 12360 Baca Ave
- 12410 Telephone Ave
- 12390 Baca Ave
- 12415 Baca Ave
- 12340 Telephone Ave
- 12350 Baca Ave
- 12410 Baca Ave
- 12420 Telephone Ave
- 12397 Telephone Ave
Your Personal Tour Guide
Ask me questions while you tour the home.