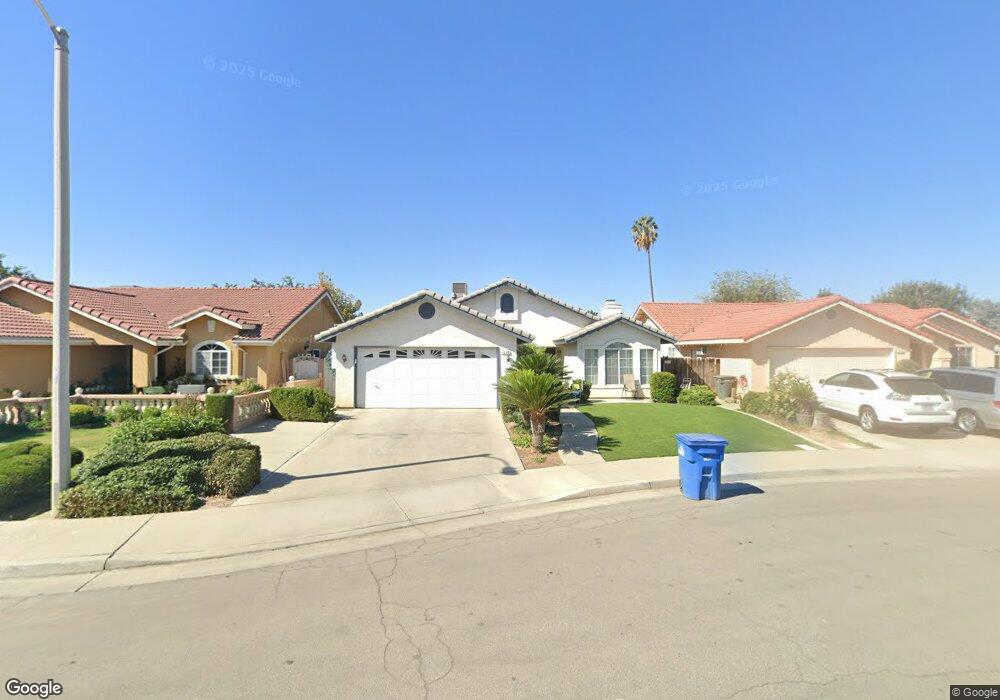
1239 Salem St Delano, CA 93215
East Delano NeighborhoodEstimated Value: $332,000 - $431,000
4
Beds
2
Baths
1,382
Sq Ft
$266/Sq Ft
Est. Value
About This Home
This home is located at 1239 Salem St, Delano, CA 93215 and is currently estimated at $367,704, approximately $266 per square foot. 1239 Salem St is a home located in Kern County with nearby schools including Harvest Elementary School, La Vina Middle School, and Cesar E. Chavez High School.
Ownership History
Date
Name
Owned For
Owner Type
Purchase Details
Closed on
Oct 3, 1997
Sold by
Cantu Jose M
Bought by
Cantu Jose M and Cantu Enriqueta
Current Estimated Value
Purchase Details
Closed on
Mar 23, 1995
Sold by
Workman Bros Development Co Inc
Bought by
Cantu Jose M
Home Financials for this Owner
Home Financials are based on the most recent Mortgage that was taken out on this home.
Original Mortgage
$91,258
Interest Rate
8.36%
Mortgage Type
FHA
Create a Home Valuation Report for This Property
The Home Valuation Report is an in-depth analysis detailing your home's value as well as a comparison with similar homes in the area
Home Values in the Area
Average Home Value in this Area
Purchase History
| Date | Buyer | Sale Price | Title Company |
|---|---|---|---|
| Cantu Jose M | -- | -- | |
| Cantu Jose M | $92,000 | Commonwealth Land Title Co |
Source: Public Records
Mortgage History
| Date | Status | Borrower | Loan Amount |
|---|---|---|---|
| Previous Owner | Cantu Jose M | $91,258 |
Source: Public Records
Tax History Compared to Growth
Tax History
| Year | Tax Paid | Tax Assessment Tax Assessment Total Assessment is a certain percentage of the fair market value that is determined by local assessors to be the total taxable value of land and additions on the property. | Land | Improvement |
|---|---|---|---|---|
| 2025 | $1,952 | $154,498 | $33,576 | $120,922 |
| 2024 | $1,952 | $151,469 | $32,918 | $118,551 |
| 2023 | $1,899 | $148,500 | $32,273 | $116,227 |
| 2022 | $1,869 | $145,590 | $31,641 | $113,949 |
| 2021 | $1,797 | $142,736 | $31,021 | $111,715 |
| 2020 | $1,795 | $141,273 | $30,703 | $110,570 |
| 2019 | $1,766 | $141,273 | $30,703 | $110,570 |
| 2018 | $1,744 | $135,788 | $29,511 | $106,277 |
| 2017 | $1,755 | $133,127 | $28,933 | $104,194 |
| 2016 | $1,728 | $130,517 | $28,366 | $102,151 |
| 2015 | $1,784 | $128,557 | $27,940 | $100,617 |
| 2014 | $1,670 | $126,040 | $27,393 | $98,647 |
Source: Public Records
Map
Nearby Homes
- 0 Cecil Ave
- 1201 Quincy St
- 1736 17th Ave
- 1732 17th Ave
- 1510 14th Ave
- 1725 17th Place
- 1612 Xenia Ct
- 1741 Vassar St
- 1518 9th Ave
- 1911 Sierra Vista Dr
- 1216 10th Ave
- 621 Union St
- 0 Lexington St
- 1901 6th Ave
- 2203 19th Ave
- 1115 Lexington St
- 800 Lexington St Unit 27
- 800 Lexington St Unit 3
- 800 Lexington St Unit 28
- 1626 Lexington St