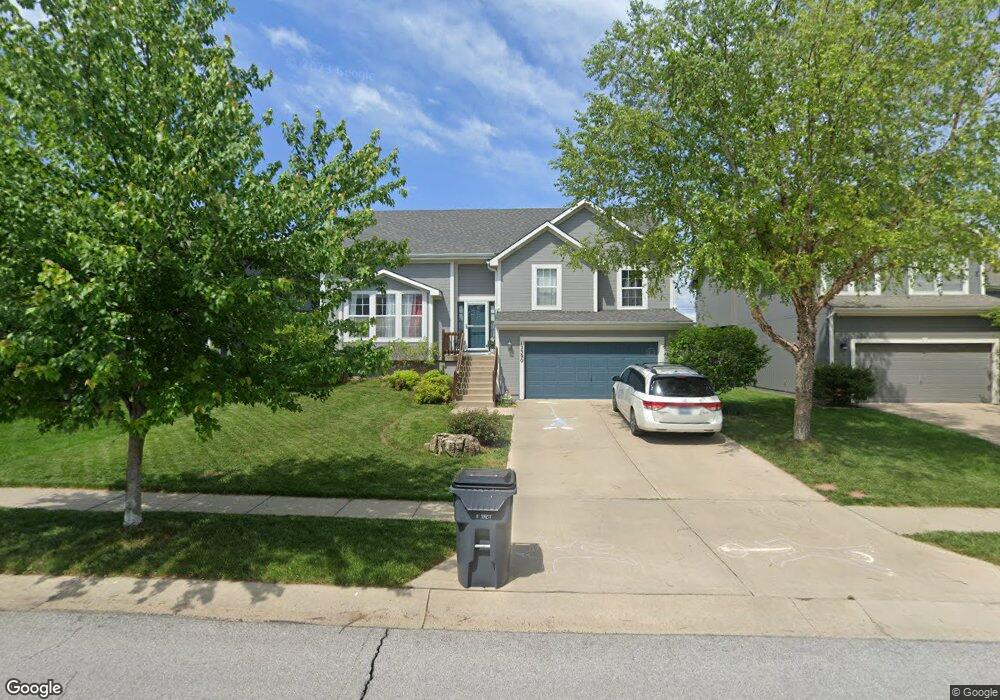
12390 S Pine St Olathe, KS 66061
Estimated Value: $408,000 - $449,000
4
Beds
3
Baths
1,422
Sq Ft
$302/Sq Ft
Est. Value
About This Home
This home is located at 12390 S Pine St, Olathe, KS 66061 and is currently estimated at $429,780, approximately $302 per square foot. 12390 S Pine St is a home located in Johnson County with nearby schools including Ravenwood Elementary School, Summit Trail Middle School, and Olathe Northwest High School.
Ownership History
Date
Name
Owned For
Owner Type
Purchase Details
Closed on
Jun 1, 2021
Sold by
John Kleffman Andrew and John Therese Laura
Bought by
Kleffman Andrew John and Kleffman Laura Therese
Current Estimated Value
Purchase Details
Closed on
Oct 23, 2009
Sold by
Fitzpatrick Scott E
Bought by
Kleffman Andrew John
Home Financials for this Owner
Home Financials are based on the most recent Mortgage that was taken out on this home.
Original Mortgage
$202,759
Interest Rate
5.03%
Mortgage Type
FHA
Purchase Details
Closed on
Aug 28, 2007
Sold by
Rodrock Homes Llc
Bought by
Fitzpatrick Scott E
Home Financials for this Owner
Home Financials are based on the most recent Mortgage that was taken out on this home.
Original Mortgage
$187,155
Interest Rate
6.72%
Mortgage Type
New Conventional
Purchase Details
Closed on
Mar 10, 2005
Sold by
Maple Brook Park Partners Llc
Bought by
Concord Homes Llc
Create a Home Valuation Report for This Property
The Home Valuation Report is an in-depth analysis detailing your home's value as well as a comparison with similar homes in the area
Home Values in the Area
Average Home Value in this Area
Purchase History
| Date | Buyer | Sale Price | Title Company |
|---|---|---|---|
| Kleffman Andrew John | -- | New Title Company Name | |
| Kleffman Andrew John | -- | First American Title Ins Co | |
| Fitzpatrick Scott E | -- | First American Title Ins Co | |
| Concord Homes Llc | -- | First American Title |
Source: Public Records
Mortgage History
| Date | Status | Borrower | Loan Amount |
|---|---|---|---|
| Previous Owner | Kleffman Andrew John | $202,759 | |
| Previous Owner | Fitzpatrick Scott E | $187,155 |
Source: Public Records
Tax History
| Year | Tax Paid | Tax Assessment Tax Assessment Total Assessment is a certain percentage of the fair market value that is determined by local assessors to be the total taxable value of land and additions on the property. | Land | Improvement |
|---|---|---|---|---|
| 2025 | $4,896 | $47,886 | $8,272 | $39,614 |
| 2024 | $4,896 | $43,528 | $8,272 | $35,256 |
| 2023 | $4,850 | $42,274 | $6,892 | $35,382 |
| 2022 | $4,408 | $37,398 | $5,989 | $31,409 |
| 2021 | $4,189 | $33,879 | $5,989 | $27,890 |
| 2020 | $4,038 | $32,373 | $5,448 | $26,925 |
| 2019 | $3,883 | $30,935 | $5,448 | $25,487 |
| 2018 | $3,594 | $28,451 | $4,736 | $23,715 |
| 2017 | $3,609 | $28,267 | $4,301 | $23,966 |
| 2016 | $3,281 | $26,370 | $4,301 | $22,069 |
| 2015 | $3,184 | $25,611 | $4,301 | $21,310 |
| 2013 | -- | $24,208 | $5,466 | $18,742 |
Source: Public Records
Map
Nearby Homes
- 12376 S Quail Ridge Dr
- 20952 W 125th Terrace
- 12112 S Redbud Ln
- 12683 S Belford St
- 12280 S Crest Dr
- 12391 S Parker Terrace
- 12187 S Troost St
- 21173 W 126th Terrace
- 1010 N Clinton St
- 1034 N Parker Terrace
- 21738 W 123rd Terrace
- 1024 N Marion St
- 19797 W 121st St
- 20145 W 119th St
- 12344 S Sagebrush Dr
- 21063 W 118th Terrace
- 21083 W 118th Terrace
- 19985 W 119th St
- 1220 N Leeview Cir
- 21050 W 118th Terrace
- 12378 S Pine St
- 12402 S Pine St
- 12414 S Pine St
- 12366 S Pine St
- 12426 S Pine St
- 12389 S Pine St
- 12354 S Pine St
- 12401 S Pine St
- 12377 S Pine St
- 20802 W 123rd Terrace
- 12413 S Pine St
- 20743 W 123rd Ct
- 12365 S Pine St
- 20763 W 123rd Ct
- 12438 S Pine St
- 12425 S Pine St
- 20810 W 123rd Terrace
- 12353 S Pine St
- 12437 S Pine St
- 12450 S Pine St
Your Personal Tour Guide
Ask me questions while you tour the home.