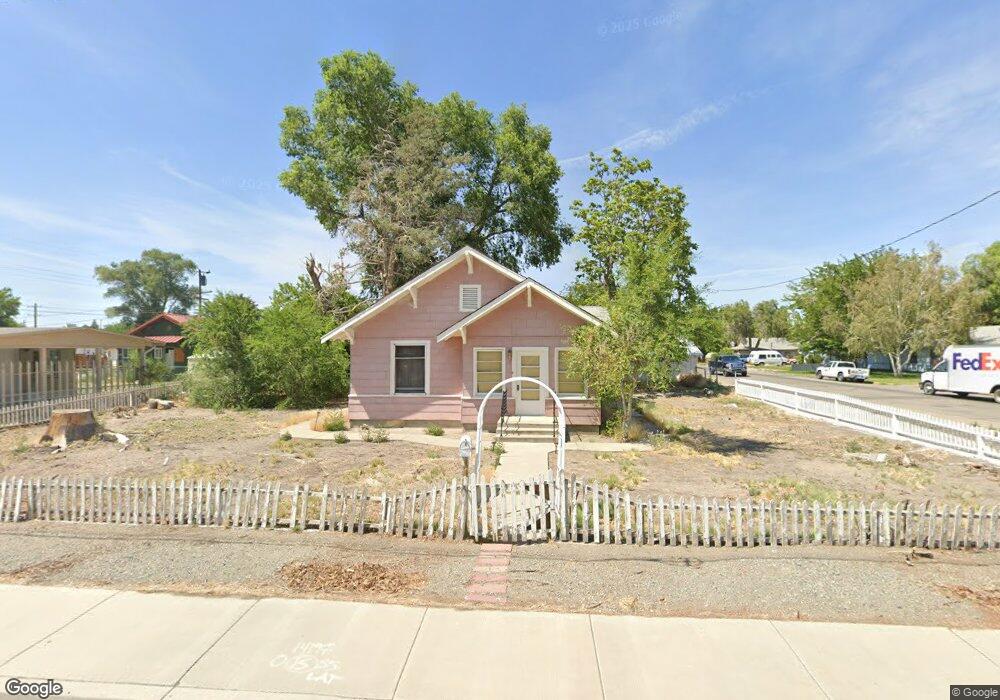
124 E Bridge St Yerington, NV 89447
Estimated Value: $207,000 - $287,000
2
Beds
1
Bath
1,255
Sq Ft
$191/Sq Ft
Est. Value
About This Home
This home is located at 124 E Bridge St, Yerington, NV 89447 and is currently estimated at $239,138, approximately $190 per square foot. 124 E Bridge St is a home located in Lyon County with nearby schools including Yerington Elementary School, Yerington Intermediate School, and Yerington High School.
Ownership History
Date
Name
Owned For
Owner Type
Purchase Details
Closed on
Mar 15, 2023
Sold by
Shipley Paris
Bought by
Paris Shipley Living Trust
Current Estimated Value
Purchase Details
Closed on
Dec 17, 2021
Sold by
Shipley Troy and Shipley Paris
Bought by
Shipley Troy and Troy Shipley Living Trust
Purchase Details
Closed on
Jan 8, 2019
Sold by
Getto Robert
Bought by
Herbst Monique
Create a Home Valuation Report for This Property
The Home Valuation Report is an in-depth analysis detailing your home's value as well as a comparison with similar homes in the area
Home Values in the Area
Average Home Value in this Area
Purchase History
| Date | Buyer | Sale Price | Title Company |
|---|---|---|---|
| Paris Shipley Living Trust | -- | -- | |
| Shipley Troy | -- | None Available | |
| Herbst Monique | -- | None Available |
Source: Public Records
Tax History
| Year | Tax Paid | Tax Assessment Tax Assessment Total Assessment is a certain percentage of the fair market value that is determined by local assessors to be the total taxable value of land and additions on the property. | Land | Improvement |
|---|---|---|---|---|
| 2025 | $954 | $48,491 | $31,500 | $16,991 |
| 2024 | $883 | $47,558 | $30,800 | $16,758 |
| 2023 | $883 | $46,152 | $30,800 | $15,352 |
| 2022 | $757 | $44,721 | $30,800 | $13,921 |
| 2021 | $701 | $19,633 | $6,300 | $13,333 |
| 2020 | $649 | $18,766 | $6,300 | $12,466 |
| 2019 | $608 | $18,086 | $6,300 | $11,786 |
| 2018 | $579 | $16,527 | $5,250 | $11,277 |
| 2017 | $556 | $16,312 | $5,250 | $11,062 |
| 2016 | $542 | $15,479 | $4,590 | $10,889 |
| 2015 | $541 | $14,964 | $4,590 | $10,374 |
| 2014 | $524 | $14,591 | $4,590 | $10,001 |
Source: Public Records
Map
Nearby Homes
- 307 S California St
- 224 S Nevada St
- 103 S Oregon St
- 6 Emilio Ct
- 308 Shawna Way
- 240 S Center St
- 41 Nevada 208
- 0 Nevada 208
- 317 S Center St
- 234 S West St
- 321 S West St
- 111 S Whitacre St
- 0 S Whitacre St Unit 250001435
- 304 S Mountain View St
- 312 Copper Pointe
- 334 Copper Pointe Cir
- 333 Copper Pointe Cir
- 313 Copper Pointe Cir
- 316 Copper Pointe Cir
- 332 Copper Pointe Cir
- 116 E Bridge St
- 116 E Bridge St
- 223 S California St
- 233 S California St
- 216 S California St
- 110 E Bridge St
- 217 S California St
- 204 E Bridge St
- 111 E Bridge St
- 102 E Bridge St
- 220 S Nevada St
- 214 S California St
- 306 S California St
- 212 S California St
- 209 S California St
- 214 S Nevada St
- 107 E Bridge St
- 211 E Bridge St
- 210 E Bridge St
- 210 S Nevada St
Your Personal Tour Guide
Ask me questions while you tour the home.