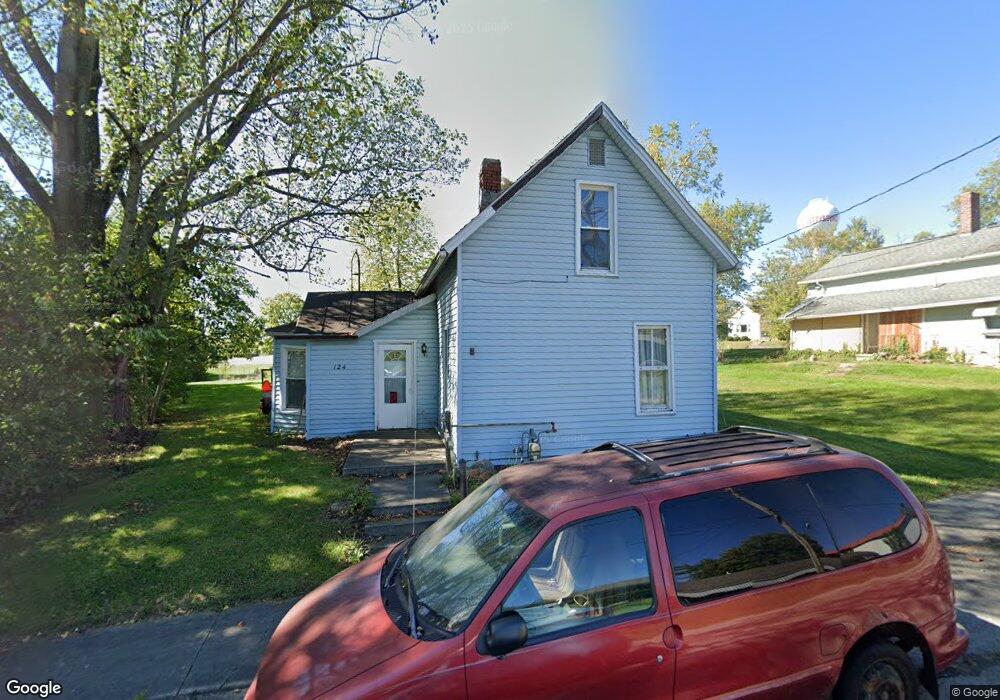
124 George St Gettysburg, OH 45328
Estimated Value: $73,587 - $154,000
3
Beds
1
Bath
1,070
Sq Ft
$101/Sq Ft
Est. Value
About This Home
This home is located at 124 George St, Gettysburg, OH 45328 and is currently estimated at $108,147, approximately $101 per square foot. 124 George St is a home located in Darke County with nearby schools including Greenville Middle School, Greenville Intermediate School, and Greenville Primary School.
Ownership History
Date
Name
Owned For
Owner Type
Purchase Details
Closed on
Sep 29, 2017
Sold by
Luginbuhl Ted A and Luginbuhl Laura
Bought by
Rue Timothy
Current Estimated Value
Purchase Details
Closed on
Jun 22, 2010
Sold by
Secretary Of Housing & Urban Development
Bought by
Luginbuhl Ted A
Purchase Details
Closed on
Oct 16, 2009
Sold by
Deeter Joshua L
Bought by
Nationwide Advantage Mortgage Company
Purchase Details
Closed on
Aug 26, 2009
Sold by
Nationwide Advantage Mortgage Company
Bought by
Secretary Of Housing & Urban Development
Purchase Details
Closed on
Aug 29, 2007
Sold by
Garber Eugene V and Garber Jane K
Bought by
Deeter Joshua L and Deeter Kimberly J
Home Financials for this Owner
Home Financials are based on the most recent Mortgage that was taken out on this home.
Original Mortgage
$64,338
Interest Rate
6.79%
Mortgage Type
FHA
Purchase Details
Closed on
Sep 1, 1987
Bought by
Luginbuhl Ted A
Create a Home Valuation Report for This Property
The Home Valuation Report is an in-depth analysis detailing your home's value as well as a comparison with similar homes in the area
Home Values in the Area
Average Home Value in this Area
Purchase History
| Date | Buyer | Sale Price | Title Company |
|---|---|---|---|
| Rue Timothy | $5,000 | Attorney | |
| Luginbuhl Ted A | $4,500 | Midwest Title Company | |
| Nationwide Advantage Mortgage Company | $24,000 | None Available | |
| Secretary Of Housing & Urban Development | -- | None Available | |
| Deeter Joshua L | $65,400 | Attorney | |
| Luginbuhl Ted A | $12,000 | -- |
Source: Public Records
Mortgage History
| Date | Status | Borrower | Loan Amount |
|---|---|---|---|
| Previous Owner | Deeter Joshua L | $64,338 |
Source: Public Records
Tax History Compared to Growth
Tax History
| Year | Tax Paid | Tax Assessment Tax Assessment Total Assessment is a certain percentage of the fair market value that is determined by local assessors to be the total taxable value of land and additions on the property. | Land | Improvement |
|---|---|---|---|---|
| 2024 | $636 | $17,220 | $6,920 | $10,300 |
| 2023 | $636 | $17,220 | $6,920 | $10,300 |
| 2022 | $621 | $15,270 | $5,800 | $9,470 |
| 2021 | $624 | $15,270 | $5,800 | $9,470 |
| 2020 | $625 | $15,270 | $5,800 | $9,470 |
| 2019 | $610 | $14,820 | $5,800 | $9,020 |
| 2018 | $643 | $14,820 | $5,800 | $9,020 |
| 2017 | $596 | $14,820 | $5,800 | $9,020 |
| 2016 | $557 | $13,340 | $5,860 | $7,480 |
| 2015 | $557 | $13,340 | $5,860 | $7,480 |
| 2014 | $557 | $13,340 | $5,860 | $7,480 |
| 2013 | $577 | $13,740 | $5,860 | $7,880 |
Source: Public Records
Map
Nearby Homes
- 209 Adams St
- 6417 Gettysburg Pitsburg Rd
- 6791 Smith Rd
- 6985 Smith Road 1
- 6350 Arcanum Bears Mill Rd
- 211 W Elm St
- 206 W Elm St
- 142 W James St
- 427 S Miami Ave
- 231 E Vine St
- 219 E Church St
- 235 E Church St
- 324 E Elm St
- 320 E Church St
- 124 E Keller St
- 310 E Main St
- 330 Liberty St
- 6459 Us Route 36
- 8363 Horatio-New Harrison Rd
- 7959 State Route 571