124 Highgate St Needham, MA 02492
Estimated Value: $1,476,000 - $1,717,000
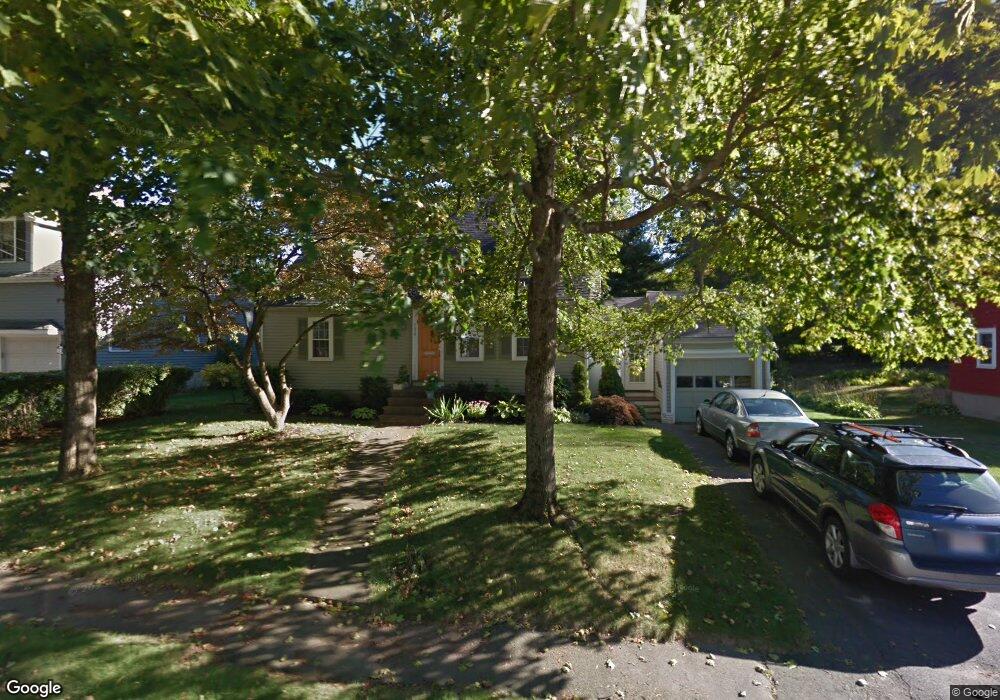
About This Home
This home is located at 124 Highgate St, Needham, MA 02492 and is currently estimated at $1,625,360, approximately $1,000 per square foot. 124 Highgate St is a home located in Norfolk County with nearby schools including Broadmeadow Elementary School, High Rock Middle School, and Pollard Middle School.
Ownership History
We collect this data history from publicly available records. To have your information removed, we recommend requesting removal directly through your county’s website.
Purchase Details
Home Financials for this Owner
Home Financials are based on the most recent Mortgage that was taken out on this home.Purchase Details
Purchase Details
Home Values in the Area
Average Home Value in this Area
Purchase History
We collect this data history from publicly available records. To have your information removed, we recommend requesting removal directly through your county’s website.
| Date | Buyer | Sale Price | Title Company |
|---|---|---|---|
| -- | None Available | ||
| -- | None Available | ||
| $216,500 | -- | ||
| $216,500 | -- | ||
| $182,500 | -- |
Mortgage History
We collect this data history from publicly available records. To have your information removed, we recommend requesting removal directly through your county’s website.
| Date | Status | Borrower | Loan Amount |
|---|---|---|---|
| Open | $724,000 | ||
| Previous Owner | $322,000 | ||
| Previous Owner | $335,000 | ||
| Previous Owner | $300,000 |
Tax History
We collect this data history from publicly available records. To have your information removed, we recommend requesting removal directly through your county’s website.
| Year | Tax Paid | Tax Assessment Tax Assessment Total Assessment is a certain percentage of the fair market value that is determined by local assessors to be the total taxable value of land and additions on the property. | Land | Improvement |
|---|---|---|---|---|
| 2025 | $12,062 | $1,137,900 | $800,400 | $337,500 |
| 2024 | $13,016 | $1,039,600 | $589,200 | $450,400 |
| 2023 | $13,104 | $1,004,900 | $589,200 | $415,700 |
| 2022 | $12,300 | $920,000 | $521,400 | $398,600 |
| 2021 | $11,988 | $920,000 | $521,400 | $398,600 |
| 2020 | $11,596 | $928,400 | $521,400 | $407,000 |
| 2019 | $10,849 | $875,600 | $474,000 | $401,600 |
| 2018 | $10,402 | $875,600 | $474,000 | $401,600 |
| 2017 | $9,788 | $823,200 | $474,000 | $349,200 |
| 2016 | $9,544 | $827,000 | $474,000 | $353,000 |
| 2015 | $9,337 | $827,000 | $474,000 | $353,000 |
| 2014 | $8,595 | $738,400 | $395,000 | $343,400 |
Map
- 22 Edwardel Rd
- 98 Falcon St
- 52 Beaufort Ave
- 60 Tudor Rd
- 19 Mount Vernon Ave
- 42 Hawthorn Ave
- 15 Hawthorn Ave
- 9 Morley St
- 89 Melrose Ave
- 212 Broad Meadow Rd
- 36 Upland Rd
- 883 Greendale Ave
- 18 Avon Cir
- 173 Fairfield St
- 277 Brookline St
- 23 Cheney St
- 96 Richdale Rd
- 246 Manning St
- 15 Lancaster Rd
- 969 Greendale Ave Unit 969
Ask me questions while you tour the home.