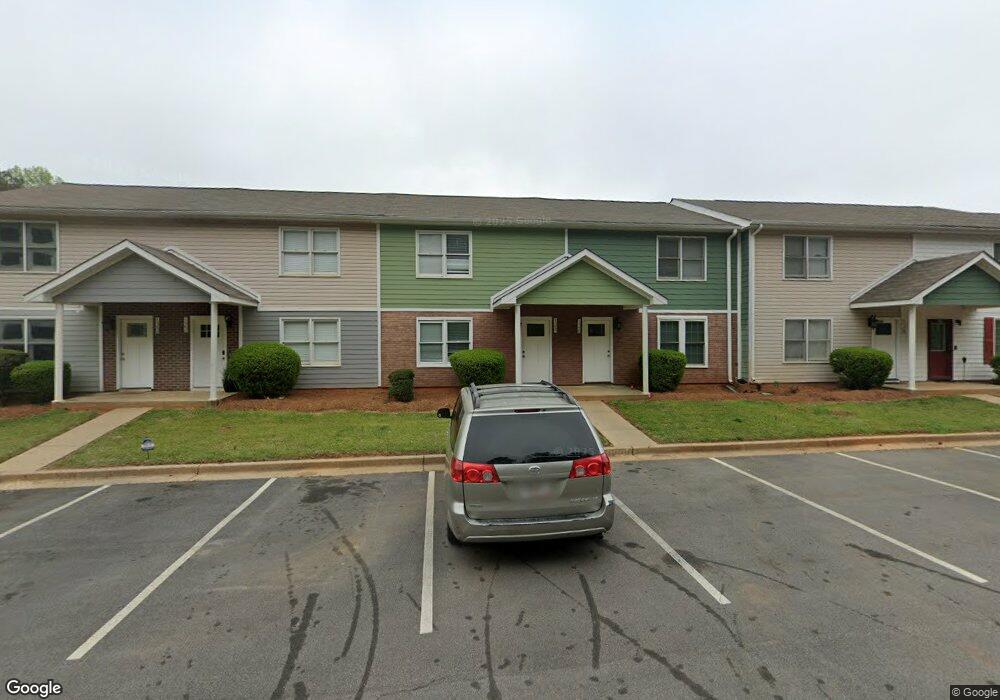
124 Hudson Bridge Ct Stockbridge, GA 30281
Estimated Value: $159,000 - $290,866
2
Beds
3
Baths
1,216
Sq Ft
$169/Sq Ft
Est. Value
About This Home
This home is located at 124 Hudson Bridge Ct, Stockbridge, GA 30281 and is currently estimated at $204,967, approximately $168 per square foot. 124 Hudson Bridge Ct is a home located in Henry County with nearby schools including Pate's Creek Elementary School, Dutchtown Middle School, and Dutchtown High School.
Ownership History
Date
Name
Owned For
Owner Type
Purchase Details
Closed on
May 5, 2021
Sold by
Godwin Investors Llc
Bought by
Mahmood Tariq
Current Estimated Value
Purchase Details
Closed on
Apr 21, 2021
Sold by
Johnson Natassia
Bought by
Godwin Investors Llc
Purchase Details
Closed on
Apr 15, 2009
Sold by
First Nlc Trust 2007-1
Bought by
Centeno Michell and Thomas Angela
Purchase Details
Closed on
Jul 1, 2008
Sold by
Cox Michael B
Bought by
Hsbc Bank Usa Na
Purchase Details
Closed on
Jan 23, 2007
Sold by
Dee Dee Dev & Inv Group Llc
Bought by
Cox Michael B
Home Financials for this Owner
Home Financials are based on the most recent Mortgage that was taken out on this home.
Original Mortgage
$120,460
Interest Rate
8.55%
Mortgage Type
New Conventional
Purchase Details
Closed on
Apr 4, 2006
Sold by
Jones Shannon
Bought by
Wells Fargo Bk Na
Create a Home Valuation Report for This Property
The Home Valuation Report is an in-depth analysis detailing your home's value as well as a comparison with similar homes in the area
Home Values in the Area
Average Home Value in this Area
Purchase History
| Date | Buyer | Sale Price | Title Company |
|---|---|---|---|
| Mahmood Tariq | $85,000 | -- | |
| Godwin Investors Llc | -- | -- | |
| Centeno Michell | $20,000 | -- | |
| Hsbc Bank Usa Na | $44,175 | -- | |
| Cox Michael B | $126,800 | -- | |
| Wells Fargo Bk Na | $94,455 | -- |
Source: Public Records
Mortgage History
| Date | Status | Borrower | Loan Amount |
|---|---|---|---|
| Previous Owner | Cox Michael B | $120,460 |
Source: Public Records
Tax History Compared to Growth
Tax History
| Year | Tax Paid | Tax Assessment Tax Assessment Total Assessment is a certain percentage of the fair market value that is determined by local assessors to be the total taxable value of land and additions on the property. | Land | Improvement |
|---|---|---|---|---|
| 2025 | $2,117 | $54,240 | $400 | $53,840 |
| 2024 | $2,117 | $51,800 | $400 | $51,400 |
| 2023 | $1,920 | $47,400 | $400 | $47,000 |
| 2022 | $1,331 | $34,000 | $374 | $33,626 |
| 2021 | $1,160 | $29,520 | $400 | $29,120 |
| 2020 | $981 | $24,800 | $400 | $24,400 |
| 2019 | $865 | $22,040 | $400 | $21,640 |
| 2018 | $756 | $19,200 | $400 | $18,800 |
| 2016 | $595 | $15,000 | $400 | $14,600 |
| 2015 | $492 | $11,960 | $400 | $11,560 |
| 2014 | $493 | $11,840 | $400 | $11,440 |
Source: Public Records
Map
Nearby Homes
- 136 N Main Dr
- 204 N Main Ct
- 190 Oakwood Cir
- 1256 Jodeco Rd
- 0 Flippen Rd Unit 10655404
- 0 Flippen Rd Unit 7690559
- 471 Jodeco Ct
- 580 Quail Run Rd
- 317 Goldenrod Dr Unit 127
- 457 Jodeco Ct
- 236 Turnstone Rd
- 195 Northpark Trail
- 34 Deer Trail
- 1805 Jodeco Rd
- 35 Deer Trail
- 0 Killearn Blvd Unit 10142611
- 500 Jodeco Station St
- 57 Jodeco Station Dr
- 353 Jodeco Station Cir E
- 1468 Flippen Rd
- 122 Hudson Bridge Ct
- 126 Hudson Bridge Ct Unit 126
- 122 Hudson Bridge Ct
- 128 Hudson Bridge Ct Unit 128
- 120 Hudson Bridge Ct
- 130 Hudson Bridge Ct
- 132 Hudson Bridge Ct
- 118 Hudson Bridge Ct
- 123 Hudson Bridge Terrace Unit 123
- 121 Hudson Bridge Terrace Unit 121
- 125 Hudson Bridge Terrace Unit 125
- 127 Hudson Bridge Terrace Unit 127
- 134 Hudson Bridge Ct Unit 134
- 116 Hudson Bridge Ct
- 119 Hudson Bridge Terrace
- 129 Hudson Bridge Terrace Unit 1
- 129 Hudson Bridge Terrace
- 129 Hudson Bridge Terrace Unit 12
- 117 Hudson Bridge Terrace
- 136 Hudson Bridge Ct Unit 136