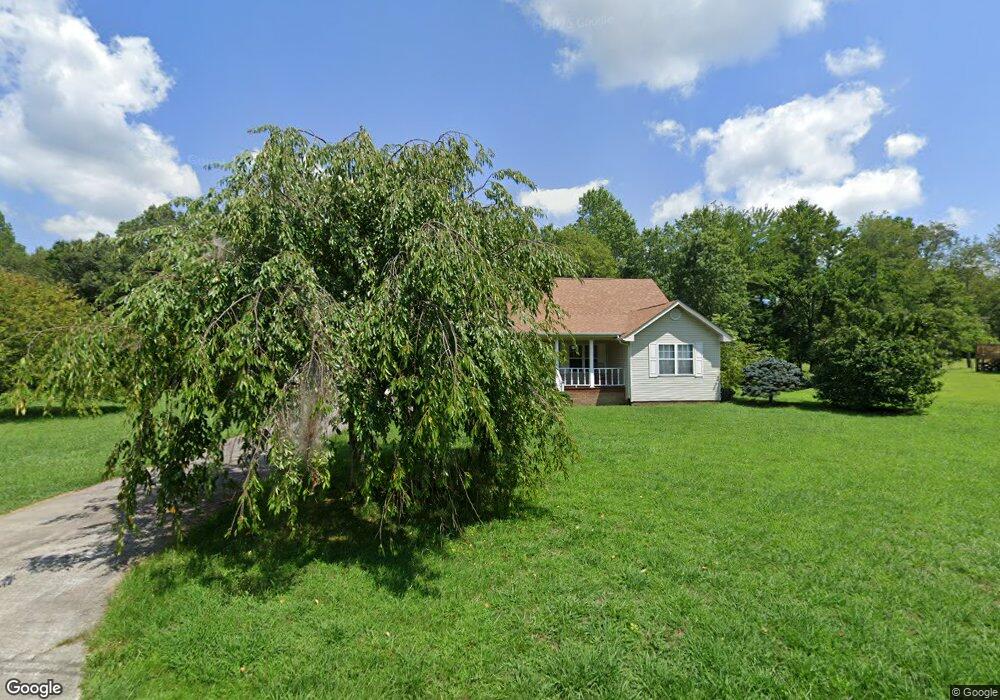
124 Kendra Rd Clarkrange, TN 38553
Estimated Value: $298,000 - $339,000
3
Beds
2
Baths
2,056
Sq Ft
$151/Sq Ft
Est. Value
About This Home
This home is located at 124 Kendra Rd, Clarkrange, TN 38553 and is currently estimated at $310,250, approximately $150 per square foot. 124 Kendra Rd is a home located in Fentress County.
Ownership History
Date
Name
Owned For
Owner Type
Purchase Details
Closed on
Jul 15, 2016
Sold by
Jones Danielle
Bought by
Jones John
Current Estimated Value
Home Financials for this Owner
Home Financials are based on the most recent Mortgage that was taken out on this home.
Original Mortgage
$129,158
Outstanding Balance
$102,695
Interest Rate
3.54%
Mortgage Type
New Conventional
Estimated Equity
$207,555
Purchase Details
Closed on
Apr 23, 2010
Sold by
Stafford Andy
Bought by
Jones John
Home Financials for this Owner
Home Financials are based on the most recent Mortgage that was taken out on this home.
Original Mortgage
$140,760
Interest Rate
4.99%
Mortgage Type
Cash
Purchase Details
Closed on
Aug 12, 2005
Sold by
Not Provided
Bought by
Jones John
Home Financials for this Owner
Home Financials are based on the most recent Mortgage that was taken out on this home.
Original Mortgage
$108,000
Interest Rate
5.61%
Mortgage Type
Cash
Purchase Details
Closed on
Sep 20, 2001
Bought by
Linder Eddie J
Purchase Details
Closed on
May 12, 1998
Bought by
Williams Jeffery A and Williams Shannon B
Create a Home Valuation Report for This Property
The Home Valuation Report is an in-depth analysis detailing your home's value as well as a comparison with similar homes in the area
Purchase History
| Date | Buyer | Sale Price | Title Company |
|---|---|---|---|
| Jones John | -- | -- | |
| Jones John | $138,000 | -- | |
| Jones John | $120,000 | -- | |
| Linder Eddie J | $119,000 | -- | |
| Williams Jeffery A | $100,000 | -- |
Source: Public Records
Mortgage History
| Date | Status | Borrower | Loan Amount |
|---|---|---|---|
| Open | Jones John | $129,158 | |
| Previous Owner | Williams Jeffery A | $140,760 | |
| Previous Owner | Jones John | $108,000 |
Source: Public Records
Tax History
| Year | Tax Paid | Tax Assessment Tax Assessment Total Assessment is a certain percentage of the fair market value that is determined by local assessors to be the total taxable value of land and additions on the property. | Land | Improvement |
|---|---|---|---|---|
| 2025 | $797 | $59,025 | $0 | $0 |
| 2024 | $797 | $59,025 | $3,775 | $55,250 |
| 2023 | $797 | $59,025 | $3,775 | $55,250 |
| 2022 | $678 | $35,475 | $2,175 | $33,300 |
| 2021 | $678 | $35,475 | $2,175 | $33,300 |
| 2020 | $678 | $35,475 | $2,175 | $33,300 |
| 2019 | $678 | $35,475 | $2,175 | $33,300 |
| 2018 | $678 | $35,475 | $2,175 | $33,300 |
| 2017 | $680 | $34,275 | $1,975 | $32,300 |
| 2016 | $680 | $34,275 | $1,975 | $32,300 |
| 2015 | $680 | $34,268 | $0 | $0 |
| 2014 | $680 | $34,268 | $0 | $0 |
Source: Public Records
Map
Nearby Homes
- 6604 S York Hwy
- 1039 Old Martha Washington Rd
- 0 Old Martha Washington Rd
- 6940 S York Hwy
- 2047 Todd Rd
- 2019 Martha Washington Rd
- 1188 Clarkrange Monterey Hwy
- 2570 Martha Washington Rd
- 1383 Old Bean Shed Rd
- 4.47 ac 523 Ferry Bend Tr
- 447 523 Ferry Bend Tr
- 106 MacA Ridge Cir
- 515 Ferry Bend Trail
- 523 Ferry Bend Trail
- 4.47 ac 523 Ferry Bend Trail
- 469 Ferry Bend Trail
- 164 Green Acres
- 3695 Martha Washington Rd
- 3669 Martha Washington Rd
- Lot 12 Ferry Bend Trail