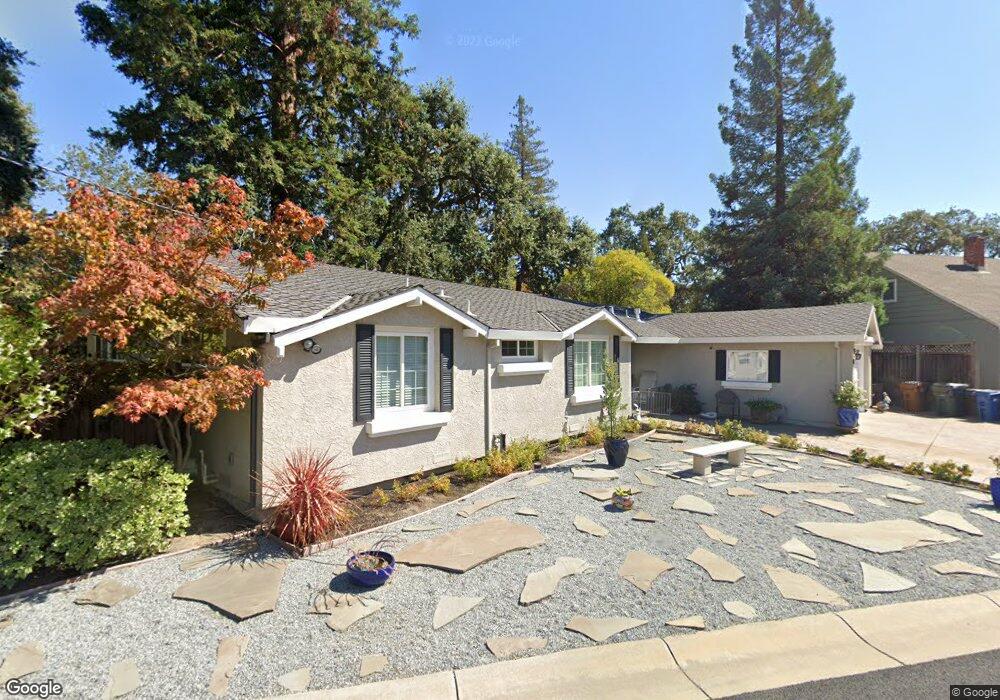
124 Mercury Way Pleasant Hill, CA 94523
Estimated Value: $1,138,000 - $1,420,000
4
Beds
2
Baths
99
Sq Ft
$13,028/Sq Ft
Est. Value
About This Home
This home is located at 124 Mercury Way, Pleasant Hill, CA 94523 and is currently estimated at $1,289,794, approximately $13,028 per square foot. 124 Mercury Way is a home located in Contra Costa County with nearby schools including Strandwood Elementary School, Pleasant Hill Middle School, and College Park High School.
Ownership History
Date
Name
Owned For
Owner Type
Purchase Details
Closed on
Feb 21, 2008
Sold by
Deverel Mary E
Bought by
Deverel Mary E
Current Estimated Value
Purchase Details
Closed on
Dec 5, 2006
Sold by
Fernandez Sheri L
Bought by
Deverel Mary E
Purchase Details
Closed on
Feb 15, 1999
Sold by
Williamson Larry R
Bought by
Fernandez Sheri L
Home Financials for this Owner
Home Financials are based on the most recent Mortgage that was taken out on this home.
Original Mortgage
$167,500
Interest Rate
6.79%
Mortgage Type
Purchase Money Mortgage
Purchase Details
Closed on
Mar 31, 1998
Sold by
Doris Ivers
Bought by
Williamson Larry R
Purchase Details
Closed on
Aug 22, 1995
Sold by
Ivers Doris
Bought by
Ivers Doris
Home Financials for this Owner
Home Financials are based on the most recent Mortgage that was taken out on this home.
Original Mortgage
$80,000
Interest Rate
7.5%
Mortgage Type
Purchase Money Mortgage
Create a Home Valuation Report for This Property
The Home Valuation Report is an in-depth analysis detailing your home's value as well as a comparison with similar homes in the area
Home Values in the Area
Average Home Value in this Area
Purchase History
| Date | Buyer | Sale Price | Title Company |
|---|---|---|---|
| Deverel Mary E | -- | None Available | |
| Deverel Mary E | $835,000 | Commonwealth Title | |
| Fernandez Sheri L | -- | -- | |
| Williamson Larry R | $167,500 | Old Republic Title Company | |
| Ivers Doris | -- | Old Republic Title Company |
Source: Public Records
Mortgage History
| Date | Status | Borrower | Loan Amount |
|---|---|---|---|
| Previous Owner | Fernandez Sheri L | $167,500 | |
| Previous Owner | Ivers Doris | $80,000 |
Source: Public Records
Tax History Compared to Growth
Tax History
| Year | Tax Paid | Tax Assessment Tax Assessment Total Assessment is a certain percentage of the fair market value that is determined by local assessors to be the total taxable value of land and additions on the property. | Land | Improvement |
|---|---|---|---|---|
| 2025 | $13,052 | $1,118,708 | $602,897 | $515,811 |
| 2024 | $12,846 | $1,096,774 | $591,076 | $505,698 |
| 2023 | $12,846 | $1,075,270 | $579,487 | $495,783 |
| 2022 | $12,339 | $1,019,000 | $549,000 | $470,000 |
| 2021 | $11,662 | $962,000 | $518,000 | $444,000 |
| 2019 | $10,909 | $887,000 | $478,024 | $408,976 |
| 2018 | $9,998 | $824,500 | $444,341 | $380,159 |
| 2017 | $9,340 | $776,000 | $418,203 | $357,797 |
| 2016 | $8,469 | $702,000 | $378,323 | $323,677 |
| 2015 | $8,493 | $698,500 | $376,437 | $322,063 |
| 2014 | $7,987 | $649,500 | $350,030 | $299,470 |
Source: Public Records
Map
Nearby Homes
- 589 Maureen Ln
- 2422 Pleasant Hill Rd Unit 6
- 309 Sunset Rd
- 5 Harwich Walk Unit 55
- 576 Best Rd
- 1919 Helen Rd Unit 2
- 368 Grapevine Place
- 808 Grayson Rd
- 505 Tananger Heights Ct
- 58 Ramsgate Ln
- 2951 Hannan Dr
- 900 Kimberly Cir
- 220 Devonshire Ct
- 25 Brandon Rd
- 277 Gloria Dr
- 117 Haven Cir
- 616 Aleta Place
- 2162 Orin Ln
- 249 Golf Links St
- 1772 Ruth Dr
- 9 Westover Ct
- 13 Westover Ct
- 118 Mercury Way
- 5 Westover Ct
- 125 Mercury Way
- 131 Mercury Way
- 17 Westover Ct
- 200 Apollo Way
- 112 Mercury Way
- 819 Vineyard Ct
- 2001 Westover Dr
- 14 Westover Ct
- 2005 Westover Dr
- 18 Tokay Ct
- 14 Tokay Ct
- 18 Westover Ct
- 206 Apollo Way
- 2009 Westover Dr
- 814 Vineyard Ct
- 21 Westover Ct