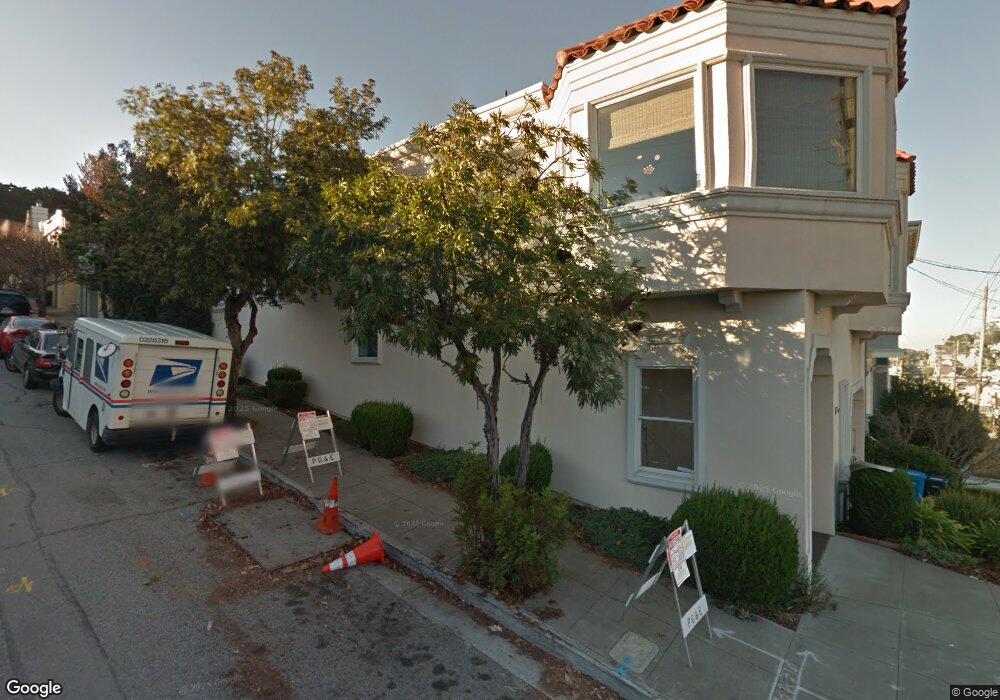
1240 Diamond St San Francisco, CA 94131
Noe Valley NeighborhoodEstimated Value: $3,168,000 - $4,423,000
4
Beds
3
Baths
3,687
Sq Ft
$1,011/Sq Ft
Est. Value
About This Home
This home is located at 1240 Diamond St, San Francisco, CA 94131 and is currently estimated at $3,728,071, approximately $1,011 per square foot. 1240 Diamond St is a home located in San Francisco County with nearby schools including Alvarado Elementary, James Lick Middle School, and St. Philip School.
Ownership History
Date
Name
Owned For
Owner Type
Purchase Details
Closed on
Sep 15, 2017
Sold by
Jahic Sejo and Jahic Jodi Sherman
Bought by
Jahic Sejo and Jahic Jodi Sherman
Current Estimated Value
Purchase Details
Closed on
Mar 1, 2006
Sold by
Afshar Robert Armon
Bought by
Jahic Sejo and Jahic Jodi Sherman
Home Financials for this Owner
Home Financials are based on the most recent Mortgage that was taken out on this home.
Original Mortgage
$50,000
Outstanding Balance
$28,275
Interest Rate
6.18%
Mortgage Type
Credit Line Revolving
Estimated Equity
$3,699,796
Purchase Details
Closed on
Dec 1, 2004
Sold by
Afshar Robert
Bought by
Afshar Robert Armon
Purchase Details
Closed on
Jul 9, 2002
Sold by
Sepahar Martina
Bought by
Afshar Robert
Home Financials for this Owner
Home Financials are based on the most recent Mortgage that was taken out on this home.
Original Mortgage
$937,500
Interest Rate
6.71%
Mortgage Type
Stand Alone First
Create a Home Valuation Report for This Property
The Home Valuation Report is an in-depth analysis detailing your home's value as well as a comparison with similar homes in the area
Home Values in the Area
Average Home Value in this Area
Purchase History
| Date | Buyer | Sale Price | Title Company |
|---|---|---|---|
| Jahic Sejo | -- | None Available | |
| Jahic Sejo | $2,000,000 | Chicago Title Co | |
| Afshar Robert Armon | -- | -- | |
| Afshar Robert | $1,375,000 | First American Title Co |
Source: Public Records
Mortgage History
| Date | Status | Borrower | Loan Amount |
|---|---|---|---|
| Open | Jahic Sejo | $50,000 | |
| Open | Jahic Sejo | $1,000,000 | |
| Previous Owner | Afshar Robert | $937,500 |
Source: Public Records
Tax History Compared to Growth
Tax History
| Year | Tax Paid | Tax Assessment Tax Assessment Total Assessment is a certain percentage of the fair market value that is determined by local assessors to be the total taxable value of land and additions on the property. | Land | Improvement |
|---|---|---|---|---|
| 2025 | $32,097 | $2,733,155 | $1,639,895 | $1,093,260 |
| 2024 | $32,097 | $2,679,565 | $1,607,741 | $1,071,824 |
| 2023 | $31,622 | $2,627,025 | $1,576,217 | $1,050,808 |
| 2022 | $31,034 | $2,575,515 | $1,545,311 | $1,030,204 |
| 2021 | $30,489 | $2,525,015 | $1,515,011 | $1,010,004 |
| 2020 | $30,607 | $2,499,125 | $1,499,477 | $999,648 |
| 2019 | $29,552 | $2,450,124 | $1,470,076 | $980,048 |
| 2018 | $28,553 | $2,402,083 | $1,441,251 | $960,832 |
| 2017 | $27,917 | $2,354,985 | $1,412,992 | $941,993 |
| 2016 | $27,495 | $2,308,810 | $1,385,287 | $923,523 |
| 2015 | $27,156 | $2,274,130 | $1,364,479 | $909,651 |
| 2014 | $26,438 | $2,229,584 | $1,337,751 | $891,833 |
Source: Public Records
Map
Nearby Homes
- 4335 Cesar Chavez St
- 4258 26th St
- 678 28th St
- 538 28th St
- 524 28th St
- 5177 Diamond Heights Blvd Unit 113
- 5140 Diamond Heights Blvd Unit 203A
- 833 Douglass St
- 561 Duncan St
- 5160 Diamond Heights Blvd Unit 107C
- 55 Red Rock Way Unit 207
- 1474 Noe St
- 464 Hoffman Ave
- 729 Douglass St
- 729 Douglass St Unit A
- 175 Red Rock Way Unit 303K
- 175 Red Rock Way Unit 101K
- 1463 Noe St
- 1485 Noe St
- 734 Elizabeth St
- 1234 Diamond St
- 1232 Diamond St
- 4314 Cesar Chavez St
- 1228 Diamond St
- 4318 Cesar Chavez St
- 4301 Cesar Chavez St
- 1220 Diamond St
- 4324 Cesar Chavez St
- 1308 Diamond St
- 2403 Diamond St
- 1214 Diamond St
- 4326 Cesar Chavez St
- 1249 Diamond St
- 1241 Diamond St
- 1314 Diamond St
- 4317 Cesar Chavez St
- 1235 Diamond St
- 4319 Cesar Chavez St Unit IT2
- 4319 Cesar Chavez St Unit T1
- 4317 26th St