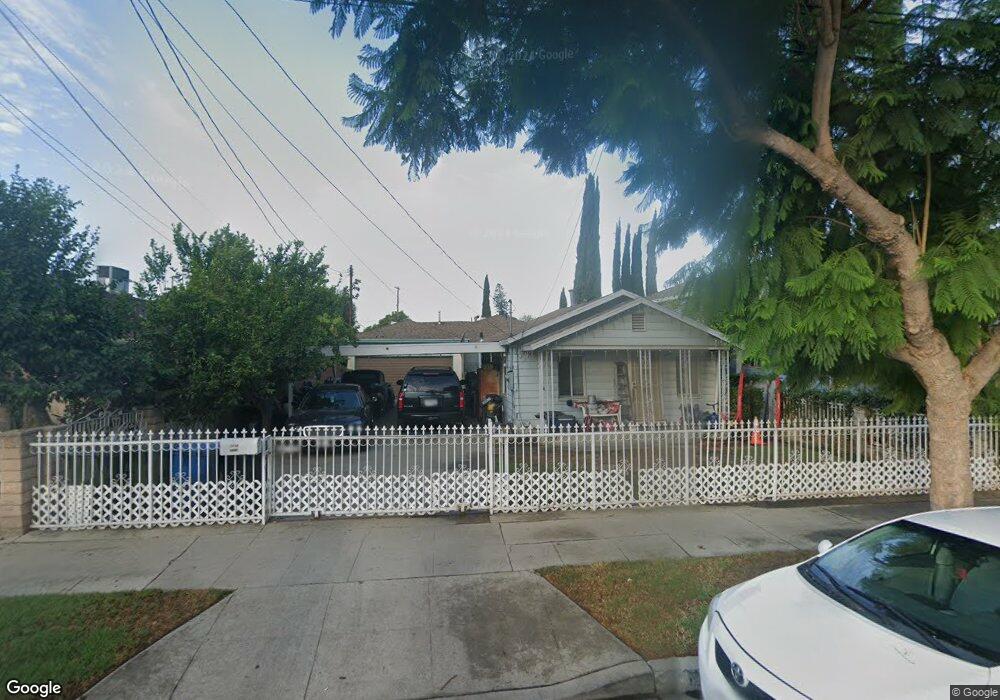
1240 Omelveny Ave San Fernando, CA 91340
Estimated Value: $695,000 - $741,329
4
Beds
2
Baths
1,250
Sq Ft
$569/Sq Ft
Est. Value
About This Home
This home is located at 1240 Omelveny Ave, San Fernando, CA 91340 and is currently estimated at $711,332, approximately $569 per square foot. 1240 Omelveny Ave is a home located in Los Angeles County with nearby schools including San Fernando Elementary School, San Fernando Middle School, and John F. Kennedy High School.
Ownership History
Date
Name
Owned For
Owner Type
Purchase Details
Closed on
Jun 24, 2008
Sold by
Rios Roman
Bought by
Rios Roman and Rios Henrietta
Current Estimated Value
Purchase Details
Closed on
Sep 15, 2003
Sold by
Rios Henrietta and Rios Eloisa V
Bought by
Rios Roman
Home Financials for this Owner
Home Financials are based on the most recent Mortgage that was taken out on this home.
Original Mortgage
$207,000
Interest Rate
6.03%
Mortgage Type
Purchase Money Mortgage
Purchase Details
Closed on
May 13, 1998
Sold by
Rios Eloisa V and Rios Roman
Bought by
Rios Roman and Rios Henrietta
Home Financials for this Owner
Home Financials are based on the most recent Mortgage that was taken out on this home.
Original Mortgage
$120,800
Interest Rate
7.13%
Purchase Details
Closed on
Sep 27, 1996
Sold by
Rios Henrietta
Bought by
Rios Roman
Purchase Details
Closed on
Mar 21, 1996
Sold by
Rios Eloisa V
Bought by
Rios Eloisa V and Rios Roman
Create a Home Valuation Report for This Property
The Home Valuation Report is an in-depth analysis detailing your home's value as well as a comparison with similar homes in the area
Home Values in the Area
Average Home Value in this Area
Purchase History
| Date | Buyer | Sale Price | Title Company |
|---|---|---|---|
| Rios Roman | -- | Chicago Title Company | |
| Rios Roman | -- | Lawyers Title Insurance Co | |
| Rios Roman | -- | Orange Coast Title | |
| Rios Roman | -- | Orange Coast Title | |
| Rios Eloisa V | -- | -- |
Source: Public Records
Mortgage History
| Date | Status | Borrower | Loan Amount |
|---|---|---|---|
| Closed | Rios Roman | $207,000 | |
| Closed | Rios Roman | $120,800 |
Source: Public Records
Tax History Compared to Growth
Tax History
| Year | Tax Paid | Tax Assessment Tax Assessment Total Assessment is a certain percentage of the fair market value that is determined by local assessors to be the total taxable value of land and additions on the property. | Land | Improvement |
|---|---|---|---|---|
| 2025 | $982 | $63,676 | $22,764 | $40,912 |
| 2024 | $982 | $62,428 | $22,318 | $40,110 |
| 2023 | $976 | $61,205 | $21,881 | $39,324 |
| 2022 | $935 | $60,005 | $21,452 | $38,553 |
| 2021 | $905 | $58,830 | $21,032 | $37,798 |
| 2020 | $923 | $58,228 | $20,817 | $37,411 |
| 2019 | $897 | $57,087 | $20,409 | $36,678 |
| 2018 | $835 | $55,968 | $20,009 | $35,959 |
| 2016 | $791 | $53,796 | $19,233 | $34,563 |
| 2015 | $786 | $52,989 | $18,945 | $34,044 |
| 2014 | $796 | $51,952 | $18,574 | $33,378 |
Source: Public Records
Map
Nearby Homes
- 14615 San Fernando Mission Blvd
- 11633 Rincon Ave
- 14655 Maclay St
- 14763 San Fernando Mission Blvd
- 14658 Maclay St
- 1037 Kewen St
- 1319 Hollister St
- 418 San Fernando Mission Blvd
- 764 Lashburn St
- 11225 Acala Ave
- 14930 Hubbard St
- 15029 Harvest St
- 11068 Sharp Ave Unit H
- 622 Griffith St
- 11951 Rossiter Place
- 14690 Hubbard St
- 11968 Rossiter Place
- 11023 Laurel Canyon Blvd
- 129 N Hagar St
- 14609 Fox St
- 1246 Omelveny Ave
- 1236 Omelveny Ave
- 11540 Amboy Ave
- 1230 Omelveny Ave
- 1230 Omelveny Ave Unit A
- 812 S Kalisher St
- 11536 Amboy Ave
- 11532 Amboy Ave
- 1226 Omelveny Ave
- 1245 Omelveny Ave
- 1237 Omelveny Ave
- 11526 Amboy Ave
- 805 S Kalisher St
- 1233 Omelveny Ave
- 11560 Amboy Ave
- 11560 Amboy Ave
- 1220 Omelveny Ave
- 1225 Omelveny Ave
- 11518 Amboy Ave
- 1303 Omelveny Ave