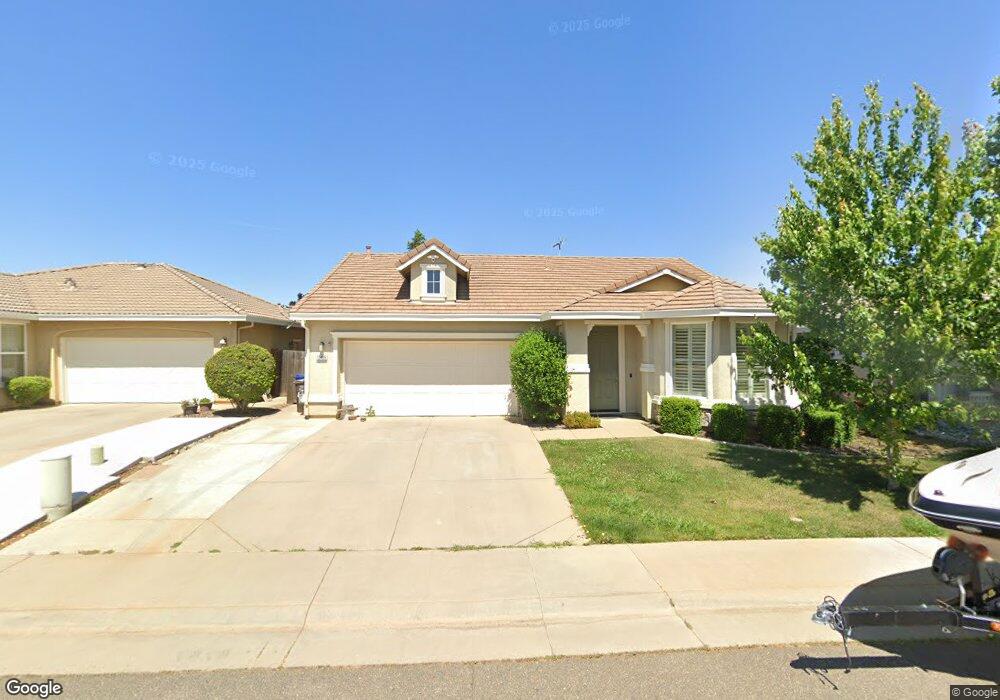
12405 Pawcatuck Way Rancho Cordova, CA 95742
Sunridge Park NeighborhoodEstimated Value: $535,000 - $566,000
3
Beds
2
Baths
1,864
Sq Ft
$296/Sq Ft
Est. Value
About This Home
This home is located at 12405 Pawcatuck Way, Rancho Cordova, CA 95742 and is currently estimated at $551,839, approximately $296 per square foot. 12405 Pawcatuck Way is a home located in Sacramento County with nearby schools including Sunrise Elementary School, Katherine L. Albiani Middle School, and Pleasant Grove High School.
Ownership History
Date
Name
Owned For
Owner Type
Purchase Details
Closed on
Jul 2, 2025
Sold by
Shurrum Jeffrey
Bought by
Jeff Shurrum Revocable Living Trust and Shurrum
Current Estimated Value
Purchase Details
Closed on
May 18, 2009
Sold by
Federal National Mortgage Association
Bought by
Shurrum Jeffrey
Home Financials for this Owner
Home Financials are based on the most recent Mortgage that was taken out on this home.
Original Mortgage
$231,684
Interest Rate
4.78%
Mortgage Type
FHA
Purchase Details
Closed on
Feb 6, 2009
Sold by
Amark Carol Jane
Bought by
Federal National Mortgage Association
Purchase Details
Closed on
Apr 11, 2007
Sold by
Beazer Homes Holdings Corp
Bought by
Amark Carol Jane
Home Financials for this Owner
Home Financials are based on the most recent Mortgage that was taken out on this home.
Original Mortgage
$274,884
Interest Rate
6.21%
Mortgage Type
New Conventional
Create a Home Valuation Report for This Property
The Home Valuation Report is an in-depth analysis detailing your home's value as well as a comparison with similar homes in the area
Home Values in the Area
Average Home Value in this Area
Purchase History
| Date | Buyer | Sale Price | Title Company |
|---|---|---|---|
| Jeff Shurrum Revocable Living Trust | -- | None Listed On Document | |
| Shurrum Jeffrey | $236,000 | Fidelity National Title Co | |
| Federal National Mortgage Association | $299,791 | Landsafe Title | |
| Amark Carol Jane | $344,000 | Chicago Title Co |
Source: Public Records
Mortgage History
| Date | Status | Borrower | Loan Amount |
|---|---|---|---|
| Previous Owner | Shurrum Jeffrey | $231,684 | |
| Previous Owner | Amark Carol Jane | $274,884 |
Source: Public Records
Tax History Compared to Growth
Tax History
| Year | Tax Paid | Tax Assessment Tax Assessment Total Assessment is a certain percentage of the fair market value that is determined by local assessors to be the total taxable value of land and additions on the property. | Land | Improvement |
|---|---|---|---|---|
| 2025 | $5,224 | $303,893 | $109,450 | $194,443 |
| 2024 | $5,224 | $297,935 | $107,304 | $190,631 |
| 2023 | $5,111 | $292,094 | $105,200 | $186,894 |
| 2022 | $5,046 | $286,368 | $103,138 | $183,230 |
| 2021 | $4,949 | $280,754 | $101,116 | $179,638 |
| 2020 | $4,891 | $277,877 | $100,080 | $177,797 |
| 2019 | $4,815 | $272,429 | $98,118 | $174,311 |
| 2018 | $5,385 | $267,089 | $96,195 | $170,894 |
| 2017 | $5,276 | $261,853 | $94,309 | $167,544 |
| 2016 | $5,074 | $256,719 | $92,460 | $164,259 |
| 2015 | $4,972 | $252,864 | $91,072 | $161,792 |
| 2014 | $4,878 | $247,912 | $89,289 | $158,623 |
Source: Public Records
Map
Nearby Homes
- 4179 Dovekie Ct
- 4180 Maple Meadows Ct
- 4183 Dovekie Ct
- 4188 Maple Meadows Ct
- 4191 Dovekie Ct
- 4192 Maple Meadows Ct
- 4199 Maple Meadows Ct
- 4208 Maple Meadows Ct
- 12389 Muir Trail Way
- 4087 Preserve Way
- 12304 Pawcatuck Way
- 12379 Alamosa Dr
- 12383 Alamosa Dr
- 12387 Alamosa Dr
- 12537 Wheat Ridge Dr
- 12391 Alamosa Dr
- 12545 Wheat Ridge Dr
- 12378 Alamosa Dr
- 12386 Alamosa Dr
- 12390 Alamosa Dr
- 12409 Pawcatuck Way
- 12401 Pawcatuck Way
- 12397 Pawcatuck Way
- 12413 Pawcatuck Way
- 4135 Borderlands Dr
- 4139 Borderlands Dr
- 12404 Pawcatuck Way
- 12400 Pawcatuck Way
- 4131 Borderlands Dr
- 4143 Borderlands Dr
- 12408 Pawcatuck Way
- 12396 Pawcatuck Way
- 4147 Cahakia Place
- 12412 Pawcatuck Way
- 4143 Cahakia Place
- 4147 Borderlands Dr
- 12392 Pawcatuck Way
- 4151 Cahakia Place
- 12428 Pawcatuck Way
- 12424 Pawcatuck Way