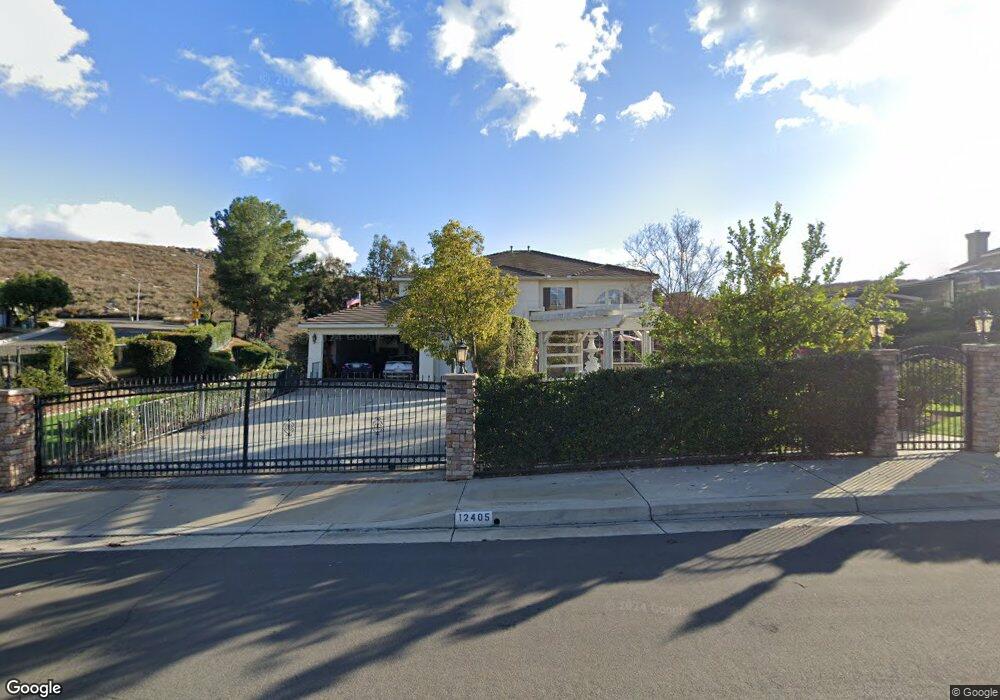
12405 Tuliptree Cir Riverside, CA 92503
Lake Hills/Victoria Grove NeighborhoodEstimated Value: $1,126,000 - $1,338,000
5
Beds
4
Baths
4,112
Sq Ft
$295/Sq Ft
Est. Value
About This Home
This home is located at 12405 Tuliptree Cir, Riverside, CA 92503 and is currently estimated at $1,214,680, approximately $295 per square foot. 12405 Tuliptree Cir is a home located in Riverside County with nearby schools including Lake Mathews Elementary School, Frank Augustus Miller Middle School, and Arlington High School.
Ownership History
Date
Name
Owned For
Owner Type
Purchase Details
Closed on
Aug 27, 2015
Sold by
Lincke Ronald and Lincke Cynthia
Bought by
The Ronald & Cynthia Lincke Revocable Tr
Current Estimated Value
Purchase Details
Closed on
Mar 25, 2010
Sold by
Norkat Financial Inc
Bought by
Lincke Ronald and Lincke Cynthia
Purchase Details
Closed on
Feb 11, 2010
Sold by
Sakai Masato
Bought by
Norkat Financial Inc
Purchase Details
Closed on
Feb 16, 2007
Sold by
Sakai Un H
Bought by
Sakai Masato
Home Financials for this Owner
Home Financials are based on the most recent Mortgage that was taken out on this home.
Original Mortgage
$650,000
Interest Rate
1.7%
Mortgage Type
New Conventional
Purchase Details
Closed on
Feb 26, 2002
Sold by
Beazer Homes Holdings Corp
Bought by
Sakai Masato and Sakai Un H
Home Financials for this Owner
Home Financials are based on the most recent Mortgage that was taken out on this home.
Original Mortgage
$448,700
Interest Rate
6.84%
Create a Home Valuation Report for This Property
The Home Valuation Report is an in-depth analysis detailing your home's value as well as a comparison with similar homes in the area
Home Values in the Area
Average Home Value in this Area
Purchase History
| Date | Buyer | Sale Price | Title Company |
|---|---|---|---|
| The Ronald & Cynthia Lincke Revocable Tr | -- | None Available | |
| Lincke Ronald | $531,000 | Advantage Title Inc | |
| Norkat Financial Inc | $409,300 | None Available | |
| Sakai Masato | -- | Chicago Title Company | |
| Sakai Masato | $561,000 | Fidelity National Title Co |
Source: Public Records
Mortgage History
| Date | Status | Borrower | Loan Amount |
|---|---|---|---|
| Previous Owner | Sakai Masato | $650,000 | |
| Previous Owner | Sakai Masato | $448,700 |
Source: Public Records
Tax History
| Year | Tax Paid | Tax Assessment Tax Assessment Total Assessment is a certain percentage of the fair market value that is determined by local assessors to be the total taxable value of land and additions on the property. | Land | Improvement |
|---|---|---|---|---|
| 2025 | $7,908 | $672,502 | $129,071 | $543,431 |
| 2023 | $7,908 | $646,390 | $124,060 | $522,330 |
| 2022 | $7,654 | $633,717 | $121,628 | $512,089 |
| 2021 | $7,509 | $621,293 | $119,244 | $502,049 |
| 2020 | $7,436 | $614,924 | $118,022 | $496,902 |
| 2019 | $7,301 | $602,867 | $115,708 | $487,159 |
| 2018 | $7,154 | $591,047 | $113,441 | $477,606 |
| 2017 | $7,020 | $579,459 | $111,217 | $468,242 |
| 2016 | $6,571 | $568,098 | $109,037 | $459,061 |
| 2015 | $6,455 | $559,566 | $107,400 | $452,166 |
| 2014 | $6,447 | $548,607 | $105,298 | $443,309 |
Source: Public Records
Map
Nearby Homes
- 17191 Greentree Dr
- 1793 Praed St
- 12257 Skywood Ct
- 17262 Carrotwood Dr
- 13024 Via Verrazano
- 1993 Lyon Ave
- 1969 Lyon Ave
- 12032 Brianwood Dr
- 13105 Via Tuscany
- 17401 La Sierra Ave
- 13122 Capricornio St
- 11322 Breithorn Ct
- 12756 Sierra Creek Dr
- 17102 Whispering Brook Way
- 14350 Blackburn Rd
- 16727 Lake Knoll Pkwy
- 17806 Cedarwood Dr
- 17727 Santa Lucia Ct
- 10717 Cleveland Ave
- 12864 Yountville Ct
- 12359 Tuliptree Cir
- 16760 Treetop Ln
- 16790 Treetop Ln
- 12400 Tuliptree Cir
- 12320 Tuliptree Cir
- 12307 Tuliptree Cir
- 16730 Treetop Ln
- 12470 Canyonwind Rd
- 12490 Canyonwind Rd
- 16663 Treetop Ln
- 16656 Treetop Ln
- 12540 Canyonwind Rd
- 12255 Tuliptree Cir
- 16643 Treetop Ln
- 12481 Canyonwind Rd
- 16636 Treetop Ln
- 16677 Orangewind Ln
- 12560 Canyonwind Rd
- 12545 Canyonwind Rd
- 12371 Orangemont Ln
Your Personal Tour Guide
Ask me questions while you tour the home.