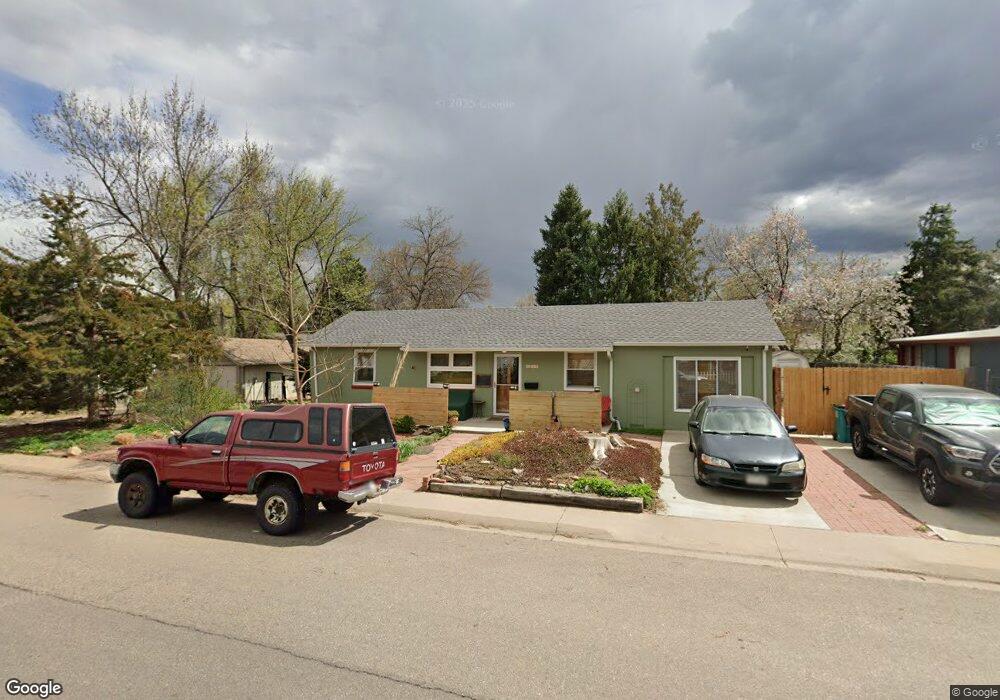
1241 Maple St Fort Collins, CO 80521
Estimated Value: $490,000 - $537,000
3
Beds
2
Baths
1,109
Sq Ft
$462/Sq Ft
Est. Value
About This Home
This home is located at 1241 Maple St, Fort Collins, CO 80521 and is currently estimated at $512,222, approximately $461 per square foot. 1241 Maple St is a home located in Larimer County with nearby schools including Putnam Elementary School, Lincoln Middle School, and Poudre High School.
Ownership History
Date
Name
Owned For
Owner Type
Purchase Details
Closed on
Sep 19, 2024
Sold by
Dilorio Celeste Carmela and Morin Cary Lewis
Bought by
Nye Elias Edward
Current Estimated Value
Purchase Details
Closed on
Nov 4, 2020
Sold by
Diiorio Celeste
Bought by
Diiorio Celeste and Morin Cary Lewis
Home Financials for this Owner
Home Financials are based on the most recent Mortgage that was taken out on this home.
Original Mortgage
$178,000
Interest Rate
2.8%
Mortgage Type
New Conventional
Purchase Details
Closed on
Jul 31, 2001
Sold by
Gabriel Jack Schechtman and Gabriel Cindy Kohn
Bought by
Diiorio Celeste
Home Financials for this Owner
Home Financials are based on the most recent Mortgage that was taken out on this home.
Original Mortgage
$142,661
Interest Rate
7.05%
Purchase Details
Closed on
Oct 1, 1994
Sold by
Johnson Dixie L
Bought by
Gabriel Jack Schechtman
Purchase Details
Closed on
May 1, 1992
Sold by
Frazier Thomas Custodian
Bought by
Johnson Dixie L
Create a Home Valuation Report for This Property
The Home Valuation Report is an in-depth analysis detailing your home's value as well as a comparison with similar homes in the area
Home Values in the Area
Average Home Value in this Area
Purchase History
| Date | Buyer | Sale Price | Title Company |
|---|---|---|---|
| Nye Elias Edward | -- | None Listed On Document | |
| Diiorio Celeste | -- | None Listed On Document | |
| Diiorio Celeste | $144,900 | Security Title | |
| Gabriel Jack Schechtman | $89,900 | -- | |
| Johnson Dixie L | $52,500 | -- |
Source: Public Records
Mortgage History
| Date | Status | Borrower | Loan Amount |
|---|---|---|---|
| Previous Owner | Diiorio Celeste | $178,000 | |
| Previous Owner | Diiorio Celeste | $142,661 |
Source: Public Records
Tax History Compared to Growth
Tax History
| Year | Tax Paid | Tax Assessment Tax Assessment Total Assessment is a certain percentage of the fair market value that is determined by local assessors to be the total taxable value of land and additions on the property. | Land | Improvement |
|---|---|---|---|---|
| 2025 | $2,647 | $31,269 | $2,345 | $28,924 |
| 2024 | $2,518 | $31,269 | $2,345 | $28,924 |
| 2022 | $2,374 | $25,146 | $2,433 | $22,713 |
| 2021 | $2,399 | $25,869 | $2,503 | $23,366 |
| 2020 | $2,245 | $23,996 | $2,503 | $21,493 |
| 2019 | $2,255 | $23,996 | $2,503 | $21,493 |
| 2018 | $1,654 | $18,144 | $2,520 | $15,624 |
| 2017 | $1,648 | $18,144 | $2,520 | $15,624 |
| 2016 | $1,615 | $17,687 | $2,786 | $14,901 |
| 2015 | $1,603 | $17,690 | $2,790 | $14,900 |
| 2014 | $1,377 | $15,100 | $2,790 | $12,310 |
Source: Public Records
Map
Nearby Homes
- 234 N Mckinley Ave
- 1349 Cherry St
- 1343 Cherry St
- 405 Franklin St
- 149 Sylvan Ct
- 200 Bishop St
- 408 Riddle Dr
- 1121 Juniper Ct
- 219 N Shields St
- 1392 Cherry St
- 1116 Beech St
- 1112 Beech St
- 1029 Laporte Ave
- 437 Clover Ln
- 1204 Pomona St
- 1255 Alameda St
- 1225 Alameda St
- 317 Wood St
- 1014 W Oak St
- 1031 W Oak St
- 1245 Maple St
- 1237 Maple St
- 231 Columbine Ct
- 1249 Maple St
- 1240 Columbine Ct
- 229 Columbine Ct
- 1233 Maple St
- 1253 Maple St
- 1236 Columbine Ct
- 1244 Maple St Unit 3
- 1244 Maple St Unit 1-4
- 1236 Maple St
- 1238 Maple St
- 240 N Mckinley Ave
- 225 Columbine Ct
- 1229 Maple St
- 238 N Mckinley Ave
- 1250 Maple St
- 1232 Columbine Ct
- 226 Columbine Ct