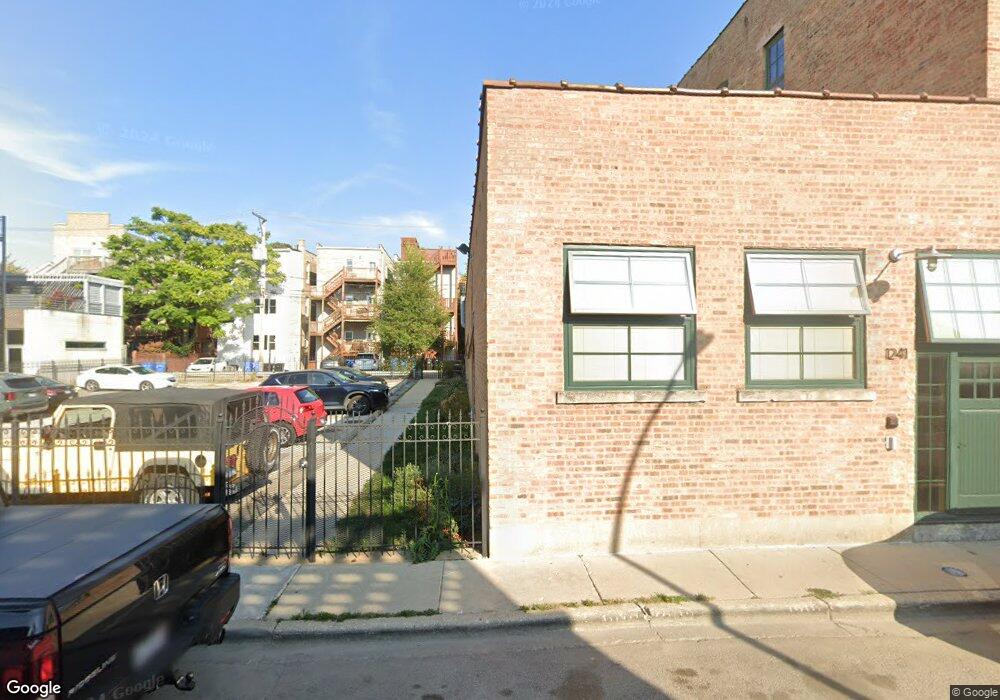
1241 N Honore St Unit 12411 Chicago, IL 60622
Wicker Park NeighborhoodEstimated Value: $629,000 - $920,000
--
Bed
--
Bath
17,600
Sq Ft
$44/Sq Ft
Est. Value
About This Home
This home is located at 1241 N Honore St Unit 12411, Chicago, IL 60622 and is currently estimated at $779,601, approximately $44 per square foot. 1241 N Honore St Unit 12411 is a home located in Cook County with nearby schools including A.N. Pritzker School, Wells Community Academy High School, and Noble St Chtr-Noble Campus.
Ownership History
Date
Name
Owned For
Owner Type
Purchase Details
Closed on
Oct 26, 2007
Sold by
Mchugh Nancy A
Bought by
Mchugh Nancy A and Kinnucan Daniel
Current Estimated Value
Home Financials for this Owner
Home Financials are based on the most recent Mortgage that was taken out on this home.
Original Mortgage
$100,000
Outstanding Balance
$63,271
Interest Rate
6.38%
Mortgage Type
New Conventional
Estimated Equity
$716,330
Purchase Details
Closed on
Jun 21, 2004
Sold by
Terlizzi James R and Terlizzi Wynne Leslie
Bought by
Mchugh Nancy A
Purchase Details
Closed on
Dec 3, 1999
Sold by
Chase Manhattan Mtg Corp
Bought by
Terlizzi James R and Terlizzi Wynne Leslie
Home Financials for this Owner
Home Financials are based on the most recent Mortgage that was taken out on this home.
Original Mortgage
$169,200
Interest Rate
8.02%
Create a Home Valuation Report for This Property
The Home Valuation Report is an in-depth analysis detailing your home's value as well as a comparison with similar homes in the area
Home Values in the Area
Average Home Value in this Area
Purchase History
| Date | Buyer | Sale Price | Title Company |
|---|---|---|---|
| Mchugh Nancy A | -- | Anchor Title Services Inc | |
| Mchugh Nancy A | $422,000 | Multiple | |
| Terlizzi James R | $211,500 | Premier Title |
Source: Public Records
Mortgage History
| Date | Status | Borrower | Loan Amount |
|---|---|---|---|
| Open | Mchugh Nancy A | $100,000 | |
| Previous Owner | Terlizzi James R | $169,200 |
Source: Public Records
Tax History Compared to Growth
Tax History
| Year | Tax Paid | Tax Assessment Tax Assessment Total Assessment is a certain percentage of the fair market value that is determined by local assessors to be the total taxable value of land and additions on the property. | Land | Improvement |
|---|---|---|---|---|
| 2024 | $16,301 | $81,062 | $20,562 | $60,500 |
| 2023 | $15,843 | $77,029 | $9,403 | $67,626 |
| 2022 | $15,843 | $77,029 | $9,403 | $67,626 |
| 2021 | $15,489 | $77,027 | $9,402 | $67,625 |
| 2020 | $13,627 | $61,172 | $9,402 | $51,770 |
| 2019 | $13,350 | $66,445 | $9,402 | $57,043 |
| 2018 | $13,125 | $66,445 | $9,402 | $57,043 |
| 2017 | $11,451 | $53,194 | $8,265 | $44,929 |
| 2016 | $10,654 | $53,194 | $8,265 | $44,929 |
| 2015 | $9,748 | $53,194 | $8,265 | $44,929 |
| 2014 | $7,044 | $37,965 | $7,336 | $30,629 |
| 2013 | $6,905 | $37,965 | $7,336 | $30,629 |
Source: Public Records
Map
Nearby Homes
- 1744 W Division St Unit 2
- 1824 W Haddon Ave
- 1222 N Paulina St
- 1234 N Paulina St
- 1320 N Moorman St
- 1850 W Thomas St
- 1648 W Division St Unit 603
- 1103 N Paulina St Unit 2
- 1261 N Paulina St Unit 7
- 1108 N Wolcott Ave
- 1258 N Milwaukee Ave Unit 3N
- 1036 N Honore St
- 1035 N Hermitage Ave Unit 3
- 1238 N Milwaukee Ave Unit 2
- 1018 N Honore St Unit C
- 1012 N Wood St Unit 2
- 1041 N Winchester Ave Unit 2
- 1056 N Marshfield Ave Unit 1
- 1019 N Wolcott Ave
- 1355 N Dean St
- 1237 N Honore St Unit 12373S
- 1237 N Honore St Unit 12372N
- 1237 N Honore St Unit 12373N
- 1237 N Honore St Unit 12371N
- 1237 N Honore St Unit 12371S
- 1237 N Honore St Unit 12371E
- 1237 N Honore St
- 1237 N Honore St Unit 3S
- 1237 N Honore St Unit 1E
- 1237 N Honore St Unit 2N
- 1235 N Honore St Unit 1E
- 1235 N Honore St Unit 12351W
- 1235 N Honore St Unit 12351E
- 1235 N Honore St Unit 1
- 1231 N Honore St Unit 12314
- 1231 N Honore St Unit 12313
- 1231 N Honore St Unit 12312
- 1231 N Honore St Unit 12311
- 1231 N Honore St Unit 2
- 1231 N Honore St Unit 4