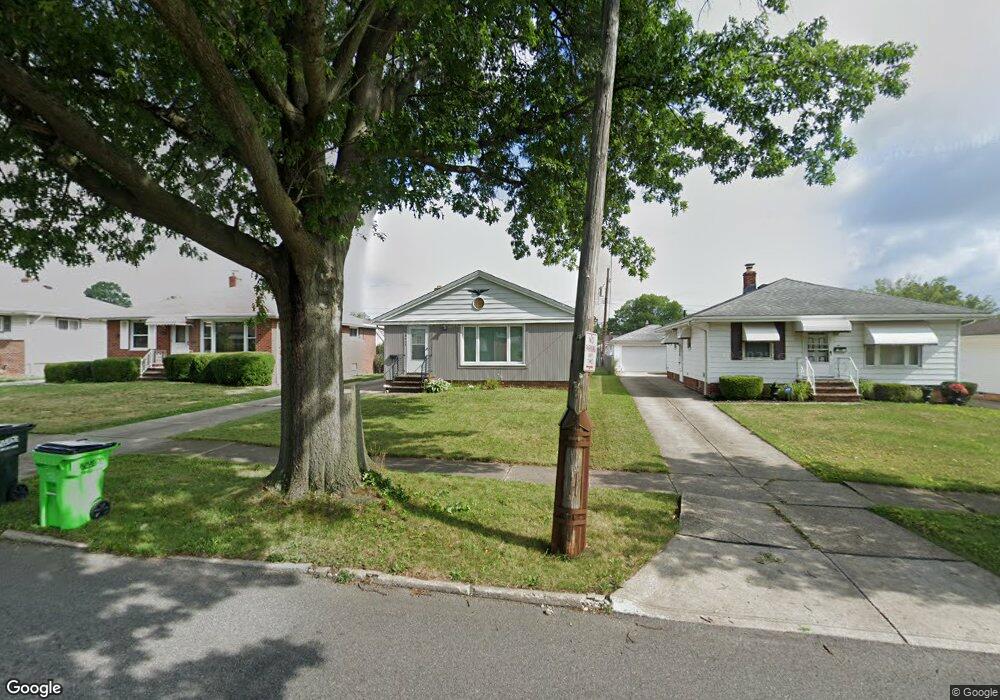
12413 Oakview Blvd Cleveland, OH 44125
Estimated Value: $140,675 - $169,000
3
Beds
1
Bath
1,740
Sq Ft
$87/Sq Ft
Est. Value
About This Home
This home is located at 12413 Oakview Blvd, Cleveland, OH 44125 and is currently estimated at $151,419, approximately $87 per square foot. 12413 Oakview Blvd is a home located in Cuyahoga County with nearby schools including Garfield Heights High School, North Shore High School, and St Benedict Catholic School.
Ownership History
Date
Name
Owned For
Owner Type
Purchase Details
Closed on
Sep 27, 2011
Sold by
First Federal Savings & Loanassociation
Bought by
Dubose Cedric D
Current Estimated Value
Home Financials for this Owner
Home Financials are based on the most recent Mortgage that was taken out on this home.
Original Mortgage
$66,763
Outstanding Balance
$46,404
Interest Rate
4.5%
Mortgage Type
FHA
Estimated Equity
$105,015
Purchase Details
Closed on
Dec 10, 2009
Sold by
Borovic Annie and Weybrecht Robin M
Bought by
Century Bank
Purchase Details
Closed on
Aug 13, 2001
Sold by
Milota Dennis E and Milota Patricia A
Bought by
Weybrecht Robin M
Home Financials for this Owner
Home Financials are based on the most recent Mortgage that was taken out on this home.
Original Mortgage
$50,000
Interest Rate
6.67%
Purchase Details
Closed on
Jan 11, 1984
Sold by
Torno Otto F and Torno Irene
Bought by
Milota Dennis E
Purchase Details
Closed on
Jan 1, 1975
Bought by
Torno Otto F and Torno Irene
Create a Home Valuation Report for This Property
The Home Valuation Report is an in-depth analysis detailing your home's value as well as a comparison with similar homes in the area
Home Values in the Area
Average Home Value in this Area
Purchase History
| Date | Buyer | Sale Price | Title Company |
|---|---|---|---|
| Dubose Cedric D | $68,500 | Old Republic Nationa | |
| Century Bank | $50,000 | Attorney | |
| Weybrecht Robin M | $100,000 | Gateway Title Agency Inc | |
| Milota Dennis E | $58,500 | -- | |
| Torno Otto F | -- | -- |
Source: Public Records
Mortgage History
| Date | Status | Borrower | Loan Amount |
|---|---|---|---|
| Open | Dubose Cedric D | $66,763 | |
| Previous Owner | Weybrecht Robin M | $50,000 |
Source: Public Records
Tax History Compared to Growth
Tax History
| Year | Tax Paid | Tax Assessment Tax Assessment Total Assessment is a certain percentage of the fair market value that is determined by local assessors to be the total taxable value of land and additions on the property. | Land | Improvement |
|---|---|---|---|---|
| 2024 | $4,522 | $44,485 | $9,030 | $35,455 |
| 2023 | $3,437 | $31,090 | $6,480 | $24,610 |
| 2022 | $3,389 | $31,080 | $6,480 | $24,610 |
| 2021 | $3,582 | $31,080 | $6,480 | $24,610 |
| 2020 | $3,073 | $24,850 | $5,180 | $19,670 |
| 2019 | $3,045 | $71,000 | $14,800 | $56,200 |
| 2018 | $3,057 | $24,850 | $5,180 | $19,670 |
| 2017 | $3,091 | $23,660 | $4,340 | $19,320 |
| 2016 | $3,136 | $23,660 | $4,340 | $19,320 |
| 2015 | $3,015 | $23,660 | $4,340 | $19,320 |
| 2014 | $3,015 | $24,920 | $4,550 | $20,370 |
Source: Public Records
Map
Nearby Homes
- 12313 Eastwood Blvd
- 12214 Woodward Blvd
- 12512 York Blvd
- 12324 Oak Park Blvd
- 11808 Fordham Rd
- 5781 Turney Rd
- 5584 Turney Rd
- 5817 Turney Rd
- 12813 Oak Park Blvd
- 12912 Thraves Rd
- 13012 Oak Park Blvd
- 13009 Oak Park Blvd
- 13206 Shady Oak Blvd
- 12913 Darlington Ave
- 13300 Shady Oak Blvd
- 13405 York Blvd
- 13402 Shady Oak Blvd
- 5570 Cumberland Dr
- 13009 Orme Rd
- 11813 Willard Ave
- 12417 Oakview Blvd
- 12409 Oakview Blvd
- 12501 Oakview Blvd
- 12405 Oakview Blvd
- 12408 Eastwood Blvd
- 12404 Eastwood Blvd
- 12412 Eastwood Blvd
- 12505 Oakview Blvd
- 12401 Oakview Blvd
- 12416 Eastwood Blvd
- 12400 Eastwood Blvd
- 12509 Oakview Blvd
- 12412 Oakview Blvd
- 12320 Eastwood Blvd
- 12408 Oakview Blvd
- 12500 Eastwood Blvd
- 12500 Oakview Blvd
- 12317 Oakview Blvd
- 12404 Oakview Blvd
- 12504 Oakview Blvd