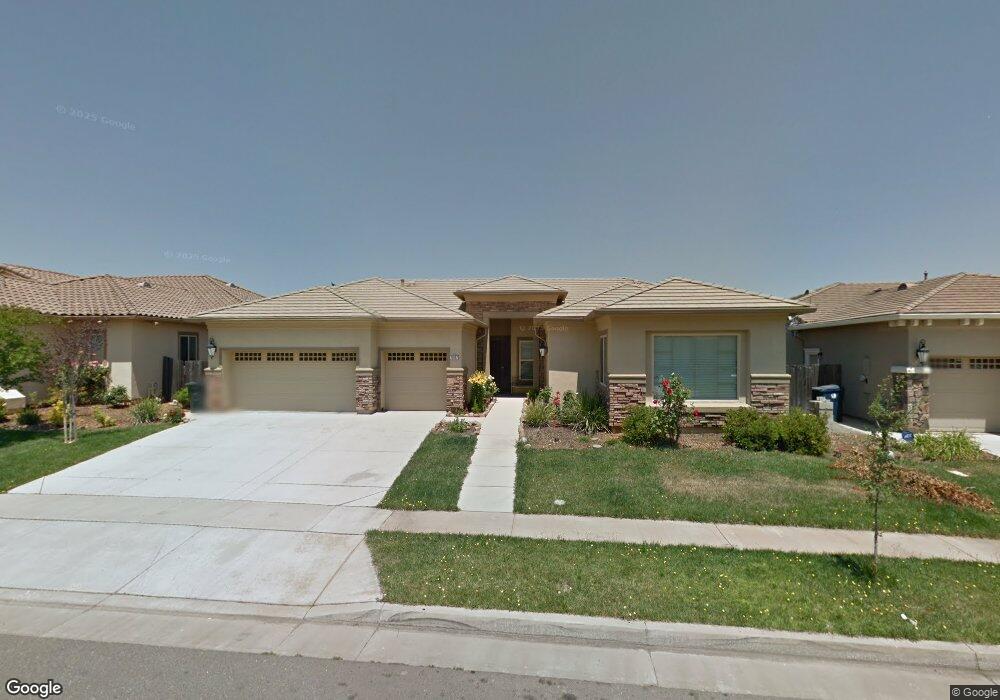
12417 Canyonlands Dr Rancho Cordova, CA 95742
Sunridge Park NeighborhoodEstimated Value: $532,000 - $755,000
3
Beds
2
Baths
2,597
Sq Ft
$264/Sq Ft
Est. Value
About This Home
This home is located at 12417 Canyonlands Dr, Rancho Cordova, CA 95742 and is currently estimated at $685,722, approximately $264 per square foot. 12417 Canyonlands Dr is a home located in Sacramento County with nearby schools including Sunrise Elementary School, Katherine L. Albiani Middle School, and Pleasant Grove High School.
Ownership History
Date
Name
Owned For
Owner Type
Purchase Details
Closed on
Oct 27, 2017
Sold by
Anderson Sean F and Foroudi Ellie
Bought by
Anderson Sean F and Anderson Michelle Alyssa Port
Current Estimated Value
Home Financials for this Owner
Home Financials are based on the most recent Mortgage that was taken out on this home.
Original Mortgage
$346,900
Outstanding Balance
$241,567
Interest Rate
3.85%
Mortgage Type
New Conventional
Estimated Equity
$444,155
Purchase Details
Closed on
Jan 2, 2008
Sold by
Anderson Sea F
Bought by
Anderson Sean F and Foroudi Ellie
Purchase Details
Closed on
Apr 26, 2007
Sold by
Woodside Mariposa Inc
Bought by
Anderson Sean
Home Financials for this Owner
Home Financials are based on the most recent Mortgage that was taken out on this home.
Original Mortgage
$392,000
Interest Rate
6.15%
Mortgage Type
Purchase Money Mortgage
Create a Home Valuation Report for This Property
The Home Valuation Report is an in-depth analysis detailing your home's value as well as a comparison with similar homes in the area
Home Values in the Area
Average Home Value in this Area
Purchase History
| Date | Buyer | Sale Price | Title Company |
|---|---|---|---|
| Anderson Sean F | -- | Fidelity National Title Comp | |
| Anderson Sean F | -- | None Available | |
| Anderson Sean | $490,000 | Placer Title Company |
Source: Public Records
Mortgage History
| Date | Status | Borrower | Loan Amount |
|---|---|---|---|
| Open | Anderson Sean F | $346,900 | |
| Closed | Anderson Sean | $392,000 |
Source: Public Records
Tax History Compared to Growth
Tax History
| Year | Tax Paid | Tax Assessment Tax Assessment Total Assessment is a certain percentage of the fair market value that is determined by local assessors to be the total taxable value of land and additions on the property. | Land | Improvement |
|---|---|---|---|---|
| 2025 | $9,029 | $656,476 | $147,366 | $509,110 |
| 2024 | $9,029 | $643,605 | $144,477 | $499,128 |
| 2023 | $8,819 | $630,987 | $141,645 | $489,342 |
| 2022 | $8,694 | $618,616 | $138,868 | $479,748 |
| 2021 | $8,557 | $606,488 | $136,146 | $470,342 |
| 2020 | $7,689 | $528,322 | $118,600 | $409,722 |
| 2019 | $7,355 | $498,418 | $111,887 | $386,531 |
| 2018 | $7,818 | $479,249 | $107,584 | $371,665 |
| 2017 | $7,392 | $443,750 | $99,615 | $344,135 |
| 2016 | $6,916 | $418,633 | $93,977 | $324,656 |
| 2015 | $6,603 | $394,938 | $88,658 | $306,280 |
| 2014 | $6,369 | $376,131 | $84,436 | $291,695 |
Source: Public Records
Map
Nearby Homes
- 12382 Canyonlands Dr
- 12409 Kibbie Lake Way
- 12460 Kibbie Lake Way
- 4082 Pinoche Peak Way
- 12337 Tawana Dome Way
- 12306 Canyonlands Dr
- 12384 Pawcatuck Way
- 11505 Douglas Rd
- 4179 Maple Meadows Ct
- 4180 Maple Meadows Ct
- 12260 Habitat Way
- 4188 Maple Meadows Ct
- 4192 Maple Meadows Ct
- 12315 Pawcatuck Way
- 4199 Maple Meadows Ct
- 4128 Pingree Lake Way
- 4208 Maple Meadows Ct
- 4074 Timberland Dr
- 12544 Ivywild Ct
- 4012 Branigan Lake Way
- 12421 Canyonlands Dr
- 12413 Canyonlands Dr
- 4033 Quarter Dome Cir
- 4037 Quarter Dome Cir
- 12409 Canyonlands Dr
- 4029 Quarter Dome Cir
- 12418 Canyonlands Dr
- 4048 Borderlands Dr
- 12422 Canyonlands Dr
- 12414 Canyonlands Dr
- 4041 Quarter Dome Cir
- 12426 Canyonlands Dr
- 12410 Canyonlands Dr
- 12405 Canyonlands Dr
- 4036 Borderlands Dr
- 4025 Quarter Dome Cir
- 4045 Quarter Dome Cir
- 12430 Canyonlands Dr
- 12406 Canyonlands Dr
- 4032 Borderlands (Lot 1 ) Dr