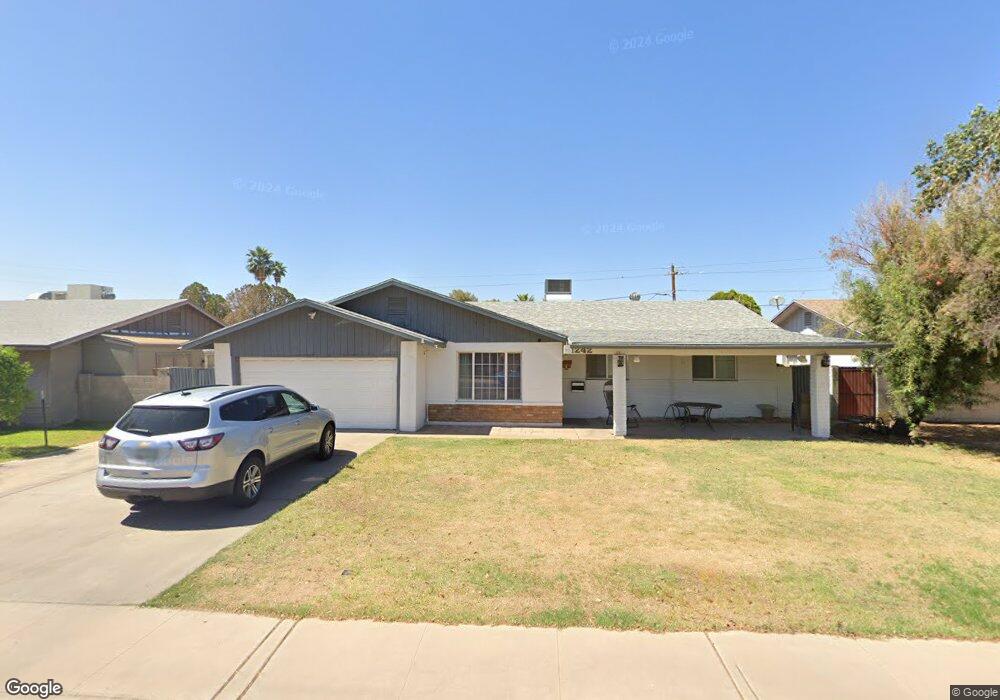
1242 E Concorda Dr Tempe, AZ 85282
Alameda NeighborhoodEstimated Value: $439,291 - $570,000
Studio
2
Baths
2,246
Sq Ft
$220/Sq Ft
Est. Value
About This Home
This home is located at 1242 E Concorda Dr, Tempe, AZ 85282 and is currently estimated at $493,073, approximately $219 per square foot. 1242 E Concorda Dr is a home located in Maricopa County with nearby schools including Joseph P. Spracale Elementary, Connolly Middle School, and McClintock High School.
Ownership History
Date
Name
Owned For
Owner Type
Purchase Details
Closed on
Feb 23, 2001
Sold by
Galbraith Dennis K and Galbraith Sherri M
Bought by
Gibbons Steven G and Gibbons Jolyn R
Current Estimated Value
Home Financials for this Owner
Home Financials are based on the most recent Mortgage that was taken out on this home.
Original Mortgage
$135,800
Outstanding Balance
$49,301
Interest Rate
6.98%
Mortgage Type
New Conventional
Estimated Equity
$443,772
Purchase Details
Closed on
May 5, 1998
Sold by
Markotic Marion A
Bought by
Galbraith Dennis K and Galbraith Sherri M
Home Financials for this Owner
Home Financials are based on the most recent Mortgage that was taken out on this home.
Original Mortgage
$111,196
Interest Rate
7.05%
Mortgage Type
New Conventional
Create a Home Valuation Report for This Property
The Home Valuation Report is an in-depth analysis detailing your home's value as well as a comparison with similar homes in the area
Home Values in the Area
Average Home Value in this Area
Purchase History
| Date | Buyer | Sale Price | Title Company |
|---|---|---|---|
| Gibbons Steven G | $140,000 | Capital Title Agency | |
| Galbraith Dennis K | $112,000 | Fidelity Title |
Source: Public Records
Mortgage History
| Date | Status | Borrower | Loan Amount |
|---|---|---|---|
| Open | Gibbons Steven G | $135,800 | |
| Previous Owner | Galbraith Dennis K | $111,196 |
Source: Public Records
Tax History
| Year | Tax Paid | Tax Assessment Tax Assessment Total Assessment is a certain percentage of the fair market value that is determined by local assessors to be the total taxable value of land and additions on the property. | Land | Improvement |
|---|---|---|---|---|
| 2025 | $2,797 | $26,828 | -- | -- |
| 2024 | $2,566 | $25,551 | -- | -- |
| 2023 | $2,566 | $41,500 | $8,300 | $33,200 |
| 2022 | $2,451 | $29,950 | $5,990 | $23,960 |
| 2021 | $2,499 | $29,080 | $5,810 | $23,270 |
| 2020 | $2,416 | $26,930 | $5,380 | $21,550 |
| 2019 | $2,370 | $24,730 | $4,940 | $19,790 |
| 2018 | $2,306 | $22,920 | $4,580 | $18,340 |
| 2017 | $2,234 | $22,070 | $4,410 | $17,660 |
| 2016 | $2,223 | $23,100 | $4,620 | $18,480 |
| 2015 | $2,150 | $22,980 | $4,590 | $18,390 |
Source: Public Records
Map
Nearby Homes
- 1233 E Broadmor Dr
- 1314 E Verlea Cir
- 1410 E Verlea Dr
- 2090 S Dorsey Ln Unit 1025
- 1412 E Broadmor Dr
- 1514 E Verlea Dr
- 1109 E Bishop Dr
- 1445 E Broadway Rd Unit 115
- 1445 E Broadway Rd Unit 106
- 1445 E Broadway Rd Unit 120
- 1445 E Broadway Rd Unit 116
- 1445 E Broadway Rd Unit 208
- 2035 S Elm St Unit 138
- 2035 S Elm St Unit 109
- 1222 E Wesleyan Dr
- 1405 E Campus Dr
- 1413 E Wesleyan Dr
- 2052 S Rural Rd Unit C
- 1491 S Rita Ln
- 921 E Campus Dr
- 1236 E Concorda Dr
- 1248 E Concorda Dr
- 1239 E Broadmor Dr
- 1230 E Concorda Dr
- 2406 S Dorsey Ln
- 1239 E Concorda Dr
- 1245 E Broadmor Dr
- 1227 E Broadmor Dr
- 1233 E Concorda Dr
- 1224 E Concorda Dr
- 2412 S Dorsey Ln
- 1221 E Broadmor Dr
- 1227 E Concorda Dr
- 2321 S Dorsey Ln Unit 7
- 2405 S Dorsey Ln
- 2315 S Dorsey Ln
- 1238 E Broadmor Dr
- 1218 E Concorda Dr
- 1215 E Broadmor Dr
- 1240 E Verlea Dr
Your Personal Tour Guide
Ask me questions while you tour the home.