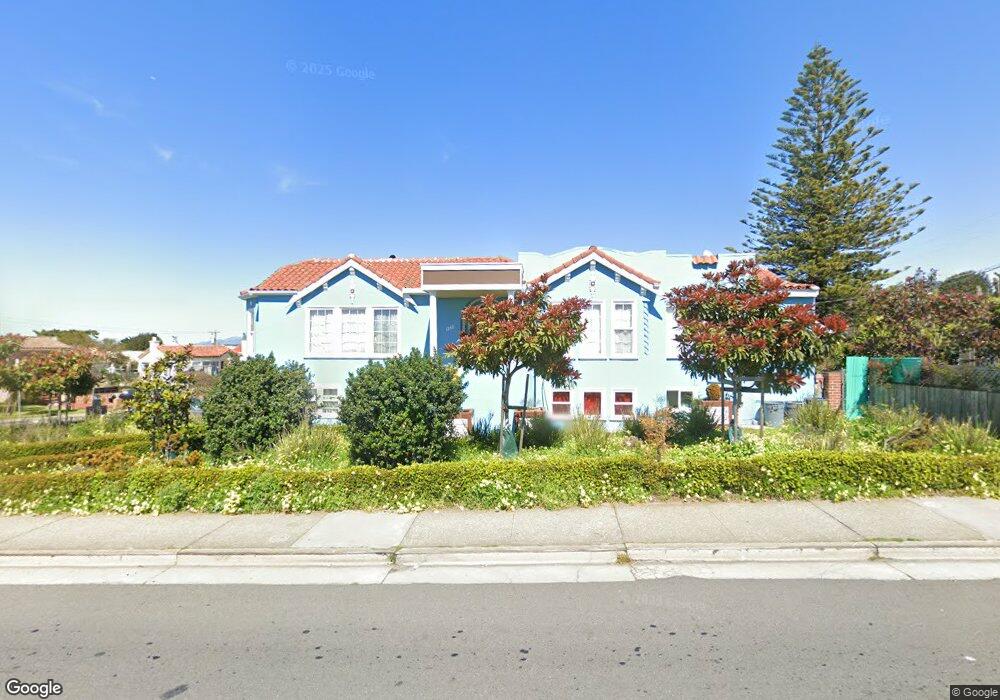
1242 Holloway Ave Unit 1244 San Francisco, CA 94132
Ingleside Terrace NeighborhoodEstimated Value: $1,841,000 - $2,293,000
6
Beds
4
Baths
3,423
Sq Ft
$627/Sq Ft
Est. Value
About This Home
This home is located at 1242 Holloway Ave Unit 1244, San Francisco, CA 94132 and is currently estimated at $2,147,188, approximately $627 per square foot. 1242 Holloway Ave Unit 1244 is a home located in San Francisco County with nearby schools including Commodore Sloat Elementary School, Aptos Middle School, and St. Stephen School.
Ownership History
Date
Name
Owned For
Owner Type
Purchase Details
Closed on
Aug 31, 1998
Sold by
Nguyen Kimtram Thi Huynh
Bought by
Nguyen Lamax
Current Estimated Value
Home Financials for this Owner
Home Financials are based on the most recent Mortgage that was taken out on this home.
Original Mortgage
$250,000
Interest Rate
6.93%
Mortgage Type
Credit Line Revolving
Create a Home Valuation Report for This Property
The Home Valuation Report is an in-depth analysis detailing your home's value as well as a comparison with similar homes in the area
Home Values in the Area
Average Home Value in this Area
Purchase History
| Date | Buyer | Sale Price | Title Company |
|---|---|---|---|
| Nguyen Lamax | -- | First American Title Ins Co |
Source: Public Records
Mortgage History
| Date | Status | Borrower | Loan Amount |
|---|---|---|---|
| Closed | Nguyen Lamax | $250,000 |
Source: Public Records
Tax History Compared to Growth
Tax History
| Year | Tax Paid | Tax Assessment Tax Assessment Total Assessment is a certain percentage of the fair market value that is determined by local assessors to be the total taxable value of land and additions on the property. | Land | Improvement |
|---|---|---|---|---|
| 2025 | $7,365 | $579,745 | $155,367 | $424,378 |
| 2024 | $7,365 | $568,379 | $152,321 | $416,058 |
| 2023 | $7,246 | $557,236 | $149,335 | $407,901 |
| 2022 | $7,095 | $546,311 | $146,407 | $399,904 |
| 2021 | $6,964 | $535,600 | $143,537 | $392,063 |
| 2020 | $7,009 | $530,110 | $142,066 | $388,044 |
| 2019 | $6,771 | $519,717 | $139,281 | $380,436 |
| 2018 | $6,543 | $509,527 | $136,550 | $372,977 |
| 2017 | $6,166 | $499,537 | $133,873 | $365,664 |
| 2016 | $3,153 | $244,565 | $133,889 | $110,676 |
| 2015 | $3,111 | $240,892 | $131,878 | $109,014 |
| 2014 | $3,029 | $236,174 | $129,295 | $106,879 |
Source: Public Records
Map
Nearby Homes