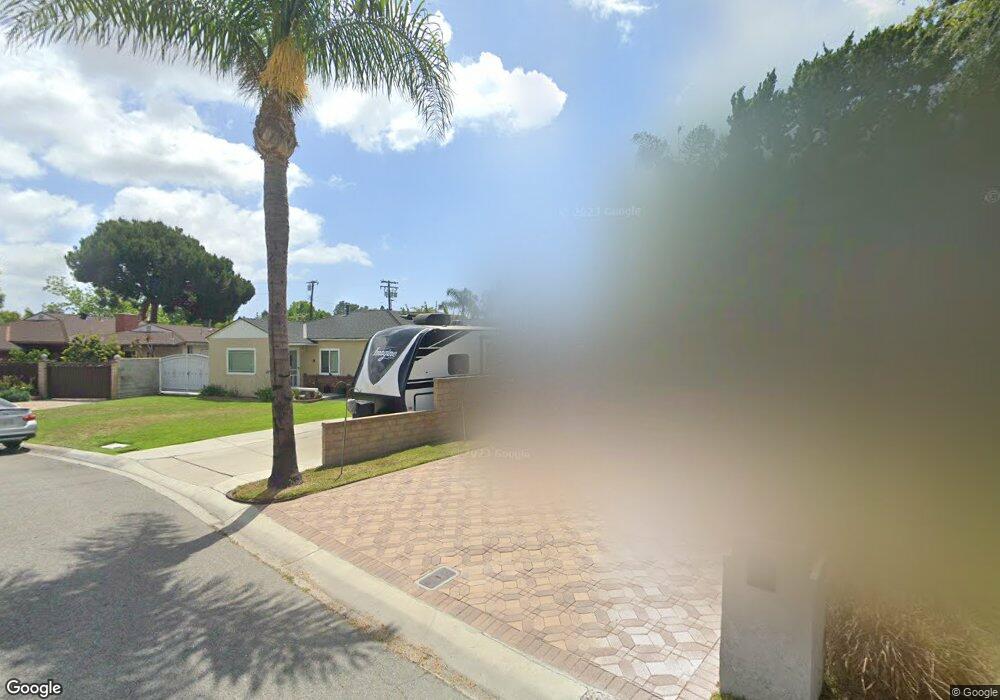
12421 Walnut Ave Garden Grove, CA 92840
Estimated Value: $1,081,000 - $1,168,000
4
Beds
2
Baths
2,000
Sq Ft
$554/Sq Ft
Est. Value
About This Home
This home is located at 12421 Walnut Ave, Garden Grove, CA 92840 and is currently estimated at $1,108,743, approximately $554 per square foot. 12421 Walnut Ave is a home located in Orange County with nearby schools including Stanley Elementary School, Garden Grove High School, and St. Columban School.
Ownership History
Date
Name
Owned For
Owner Type
Purchase Details
Closed on
Mar 13, 2024
Sold by
Lopez Jose Manuel and Lopez Michelle Marie
Bought by
Lopez Family Living Trust and Lopez
Current Estimated Value
Purchase Details
Closed on
Aug 3, 2000
Sold by
Daniel Roberts
Bought by
Lopez Jose Manuel and Lopez Michelle Marie
Home Financials for this Owner
Home Financials are based on the most recent Mortgage that was taken out on this home.
Original Mortgage
$210,800
Interest Rate
8.07%
Purchase Details
Closed on
Aug 17, 1998
Sold by
Hunt Gary S and Hunt Lisa Y
Bought by
Roberts Daniel
Home Financials for this Owner
Home Financials are based on the most recent Mortgage that was taken out on this home.
Original Mortgage
$150,500
Interest Rate
11.5%
Create a Home Valuation Report for This Property
The Home Valuation Report is an in-depth analysis detailing your home's value as well as a comparison with similar homes in the area
Home Values in the Area
Average Home Value in this Area
Purchase History
| Date | Buyer | Sale Price | Title Company |
|---|---|---|---|
| Lopez Family Living Trust | -- | None Listed On Document | |
| Lopez Jose Manuel | $263,500 | Lawyers Title Company | |
| Roberts Daniel | $215,000 | South Coast Title Company |
Source: Public Records
Mortgage History
| Date | Status | Borrower | Loan Amount |
|---|---|---|---|
| Previous Owner | Lopez Jose Manuel | $210,800 | |
| Previous Owner | Roberts Daniel | $150,500 | |
| Closed | Roberts Daniel | $21,500 | |
| Closed | Lopez Jose Manuel | $26,350 |
Source: Public Records
Tax History Compared to Growth
Tax History
| Year | Tax Paid | Tax Assessment Tax Assessment Total Assessment is a certain percentage of the fair market value that is determined by local assessors to be the total taxable value of land and additions on the property. | Land | Improvement |
|---|---|---|---|---|
| 2025 | $5,127 | $601,832 | $295,710 | $306,122 |
| 2024 | $5,127 | $389,260 | $289,912 | $99,348 |
| 2023 | $4,885 | $381,628 | $284,228 | $97,400 |
| 2022 | $4,775 | $374,146 | $278,655 | $95,491 |
| 2021 | $4,707 | $366,810 | $273,191 | $93,619 |
| 2020 | $4,650 | $363,049 | $270,389 | $92,660 |
| 2019 | $4,586 | $355,931 | $265,087 | $90,844 |
| 2018 | $4,474 | $348,952 | $259,889 | $89,063 |
| 2017 | $4,426 | $342,110 | $254,793 | $87,317 |
| 2016 | $4,206 | $335,402 | $249,797 | $85,605 |
| 2015 | $4,150 | $330,364 | $246,044 | $84,320 |
| 2014 | $4,052 | $323,893 | $241,224 | $82,669 |
Source: Public Records
Map
Nearby Homes
- 11081 Iris Dr
- 12332 Euclid St
- 11052 Peppertree Ln
- 12600 Euclid St Unit 19
- 12555 S Euclid St Unit 32
- 12555 Euclid St Unit 2
- 12555 Euclid St Unit 79
- 12555 Euclid St Unit 61
- 12256 Lesley St
- 11102 Avolencia Place
- 12071 Diane St
- 12677 8th St
- 10882 Chapman Ave
- 11252 Chapman Ave
- 10560 Lakeside Dr N Unit B
- 10580 Lakeside Dr N Unit E
- 10521 Lakeside Dr S Unit I
- 10541 Lakeside Dr S Unit P
- 10520 Lakeside Dr N Unit L
- 10442 Lampson Ave
- 12411 Walnut Ave
- 12431 Walnut Ave
- 12401 Walnut Ave
- 12432 Euclid St
- 12422 Walnut Ave
- 12441 Walnut Ave
- 12381 Walnut Ave
- 11041 Lampson Ave
- 11083 Violet Dr
- 11072 Iris Dr
- 11051 Lampson Ave
- 11061 Lampson Ave
- 12371 Walnut Ave
- 12460 Euclid St
- 12460 Euclid St Unit 103
- 12460 Euclid St Unit 200
- 12460 Euclid St Unit 103
- 12460 Euclid St Unit 203
- 11082 Iris Dr
- 11082 Violet Dr