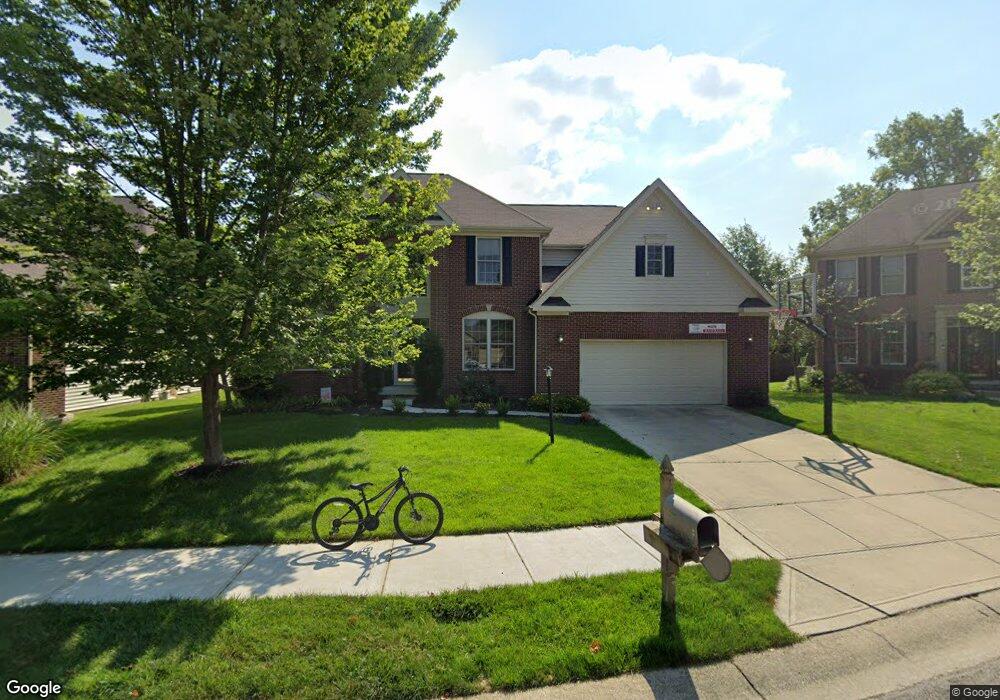
12427 Hurlock Dr Fishers, IN 46037
Estimated Value: $517,000 - $545,000
5
Beds
4
Baths
3,943
Sq Ft
$135/Sq Ft
Est. Value
About This Home
This home is located at 12427 Hurlock Dr, Fishers, IN 46037 and is currently estimated at $531,253, approximately $134 per square foot. 12427 Hurlock Dr is a home located in Hamilton County with nearby schools including Brooks School Elementary School, Fall Creek Intermediate School, and Sioux Center High School.
Ownership History
Date
Name
Owned For
Owner Type
Purchase Details
Closed on
Jun 29, 2010
Sold by
Rudmann Daniel G and Rudmann Cathryn L
Bought by
Mason Richard G and Mason Julie M
Current Estimated Value
Home Financials for this Owner
Home Financials are based on the most recent Mortgage that was taken out on this home.
Original Mortgage
$239,200
Outstanding Balance
$160,060
Interest Rate
4.86%
Mortgage Type
New Conventional
Estimated Equity
$371,193
Purchase Details
Closed on
Feb 17, 2006
Sold by
The Estridge Group Inc
Bought by
Rudmann Daniel G and Rudmann Cathryn L
Home Financials for this Owner
Home Financials are based on the most recent Mortgage that was taken out on this home.
Original Mortgage
$251,100
Interest Rate
6.2%
Mortgage Type
Fannie Mae Freddie Mac
Purchase Details
Closed on
Sep 2, 2005
Sold by
Estridge Development Co Inc
Bought by
The Estridge Group Inc
Create a Home Valuation Report for This Property
The Home Valuation Report is an in-depth analysis detailing your home's value as well as a comparison with similar homes in the area
Home Values in the Area
Average Home Value in this Area
Purchase History
| Date | Buyer | Sale Price | Title Company |
|---|---|---|---|
| Mason Richard G | -- | None Available | |
| Rudmann Daniel G | -- | None Available | |
| The Estridge Group Inc | -- | -- |
Source: Public Records
Mortgage History
| Date | Status | Borrower | Loan Amount |
|---|---|---|---|
| Open | Mason Richard G | $239,200 | |
| Previous Owner | Rudmann Daniel G | $251,100 |
Source: Public Records
Tax History Compared to Growth
Tax History
| Year | Tax Paid | Tax Assessment Tax Assessment Total Assessment is a certain percentage of the fair market value that is determined by local assessors to be the total taxable value of land and additions on the property. | Land | Improvement |
|---|---|---|---|---|
| 2024 | $4,910 | $437,900 | $82,000 | $355,900 |
| 2023 | $4,910 | $425,600 | $82,000 | $343,600 |
| 2022 | $4,636 | $386,700 | $82,000 | $304,700 |
| 2021 | $3,975 | $332,300 | $82,000 | $250,300 |
| 2020 | $3,980 | $328,700 | $82,000 | $246,700 |
| 2019 | $3,840 | $317,400 | $61,200 | $256,200 |
| 2018 | $3,776 | $311,400 | $61,200 | $250,200 |
| 2017 | $3,451 | $289,700 | $61,200 | $228,500 |
| 2016 | $3,511 | $294,800 | $61,200 | $233,600 |
| 2014 | $3,020 | $278,900 | $54,100 | $224,800 |
| 2013 | $3,020 | $265,900 | $54,100 | $211,800 |
Source: Public Records
Map
Nearby Homes
- 12218 Weathered Edge Dr
- 12036 Weathered Edge Dr
- 12307 Chiseled Stone Dr
- 12337 River Valley Dr
- 12230 Cobblestone Dr
- 12635 Touchdown Dr
- 12604 Brooks School Rd
- 12641 Chiefs Ct
- 12622 Whisper Way
- 12404 Titans Dr
- 12236 Quarterback Ln
- 12419 Brandamore Ln
- 12599 Brookdale Dr
- 13091 Duval Dr
- 11581 Ludlow Dr
- 12075 Scoria Dr Unit 500
- 12552 Majestic Way
- 11932 Hollyhock Dr
- 12523 Courage Crossing
- 11579 Townsend Ct
- 12439 Hurlock Dr
- 12415 Hurlock Dr
- 12403 Hurlock Dr
- 12438 Hurlock Dr
- 12451 Hurlock Dr
- 12450 Hurlock Dr
- 12414 Hurlock Dr
- 12463 Hurlock Dr
- 12228 Weathered Edge Dr
- 12208 Weathered Edge Dr
- 12238 Weathered Edge Dr
- 12198 Weathered Edge Dr
- 12248 Weathered Edge Dr
- 12188 Weathered Edge Dr
- 12197 Biddle Dr
- 12241 Biddle Dr
- 12475 Hurlock Dr
- 12213 Biddle Dr
- 12181 Biddle Dr
- 13121 Biddle Dr