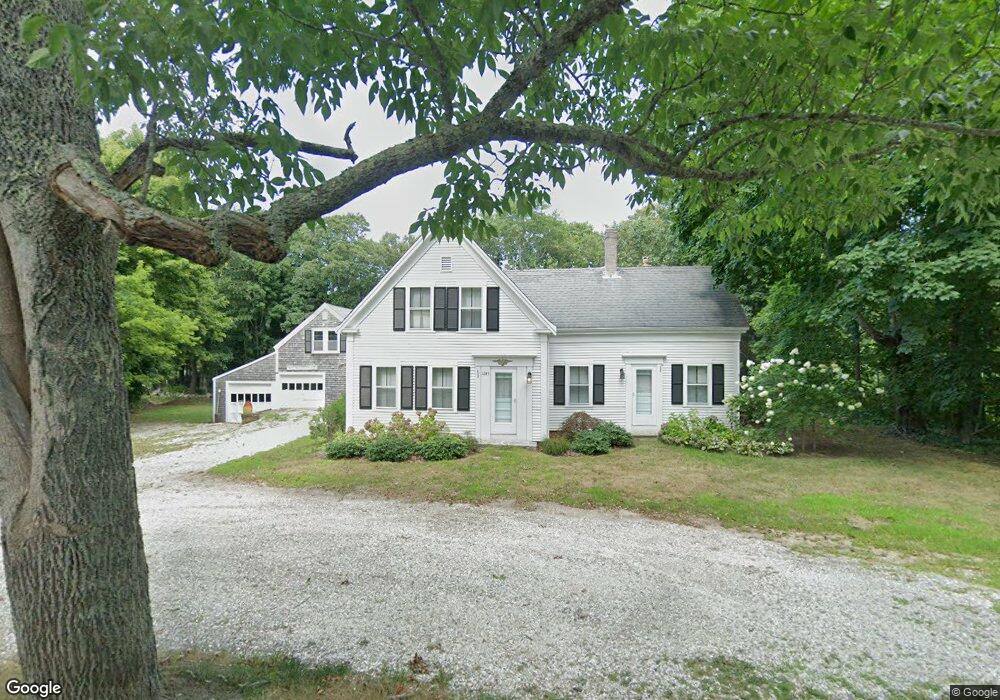
1243 Main St Brewster, MA 02631
Estimated Value: $793,000 - $858,000
4
Beds
3
Baths
2,046
Sq Ft
$402/Sq Ft
Est. Value
About This Home
This home is located at 1243 Main St, Brewster, MA 02631 and is currently estimated at $822,975, approximately $402 per square foot. 1243 Main St is a home located in Barnstable County with nearby schools including Stony Brook Elementary School, Eddy Elementary School, and Nauset Regional Middle School.
Ownership History
Date
Name
Owned For
Owner Type
Purchase Details
Closed on
Jan 20, 2015
Sold by
Daley Ft and Daley
Bought by
Daley Jacob H
Current Estimated Value
Purchase Details
Closed on
Oct 9, 2013
Sold by
Daley Paul H and Daley Mitzi
Bought by
Daley Ft and Daley
Home Financials for this Owner
Home Financials are based on the most recent Mortgage that was taken out on this home.
Original Mortgage
$280,000
Interest Rate
4.53%
Mortgage Type
New Conventional
Purchase Details
Closed on
Dec 28, 2001
Sold by
Rhodes W Anthony W and Rhodes Lara L
Bought by
Daley Paul H
Create a Home Valuation Report for This Property
The Home Valuation Report is an in-depth analysis detailing your home's value as well as a comparison with similar homes in the area
Home Values in the Area
Average Home Value in this Area
Purchase History
| Date | Buyer | Sale Price | Title Company |
|---|---|---|---|
| Daley Jacob H | -- | -- | |
| Daley Ft | $295,000 | -- | |
| Daley Paul H | $245,000 | -- |
Source: Public Records
Mortgage History
| Date | Status | Borrower | Loan Amount |
|---|---|---|---|
| Previous Owner | Daley Ft | $280,000 | |
| Previous Owner | Daley Paul H | $85,000 |
Source: Public Records
Tax History
| Year | Tax Paid | Tax Assessment Tax Assessment Total Assessment is a certain percentage of the fair market value that is determined by local assessors to be the total taxable value of land and additions on the property. | Land | Improvement |
|---|---|---|---|---|
| 2025 | $4,429 | $643,700 | $253,400 | $390,300 |
| 2024 | $4,145 | $608,600 | $239,100 | $369,500 |
| 2023 | $3,812 | $545,300 | $213,400 | $331,900 |
| 2022 | $3,455 | $440,100 | $160,000 | $280,100 |
| 2021 | $3,310 | $385,800 | $139,100 | $246,700 |
| 2020 | $3,039 | $352,600 | $139,100 | $213,500 |
| 2019 | $3,252 | $340,300 | $133,800 | $206,500 |
| 2018 | $2,756 | $333,700 | $133,800 | $199,900 |
| 2017 | $2,598 | $309,700 | $133,800 | $175,900 |
| 2016 | $2,561 | $303,800 | $131,200 | $172,600 |
| 2015 | $2,454 | $297,100 | $128,600 | $168,500 |
Source: Public Records
Map
Nearby Homes
- 53 Brier Ln
- 20 Spring Ln
- 1580 Main St
- 309 Great Fields Rd
- 279 Alden Dr
- 240 Robbins Hill Rd
- 31 Hazel Ln
- 0 Ridgewood Dr
- 13 Sand Dollar Ln
- 13 Sand Dollar Ln Unit 20
- 9 Cockle Way Unit 9
- 9 Cockle Way Unit 9
- 1861 Main St
- 11 Juniper Cir
- 11 Juniper Cir Unit 11
- 18 Juniper Cir Unit 18
- 117 A p Newcomb Rd
- 98 Leland Rd
- 0 Canoe Pond Dr
- 80 Abby Rd
Your Personal Tour Guide
Ask me questions while you tour the home.