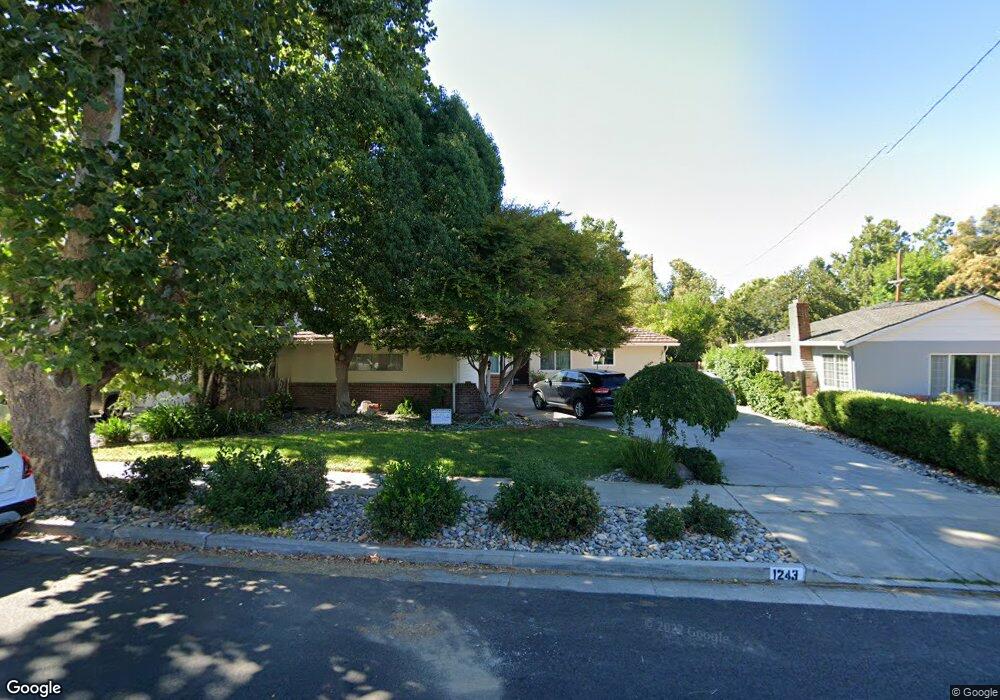
1243 Norval Way San Jose, CA 95125
Willow Glen NeighborhoodEstimated Value: $1,772,000 - $2,092,000
3
Beds
3
Baths
1,635
Sq Ft
$1,199/Sq Ft
Est. Value
About This Home
This home is located at 1243 Norval Way, San Jose, CA 95125 and is currently estimated at $1,960,809, approximately $1,199 per square foot. 1243 Norval Way is a home located in Santa Clara County with nearby schools including Booksin Elementary, Willow Glen Middle, and Willow Glen High School.
Ownership History
Date
Name
Owned For
Owner Type
Purchase Details
Closed on
Mar 27, 2024
Sold by
Henry-Ueno Sydney E
Bought by
Ueno Kurt Y
Current Estimated Value
Home Financials for this Owner
Home Financials are based on the most recent Mortgage that was taken out on this home.
Original Mortgage
$2,850,000
Outstanding Balance
$2,848,975
Interest Rate
6.88%
Mortgage Type
Credit Line Revolving
Estimated Equity
-$888,166
Purchase Details
Closed on
Mar 14, 2024
Sold by
1996 Kay Ueno Revocable Trust and Ueno Kurt Yoshio
Bought by
Ueno Kurt Y
Home Financials for this Owner
Home Financials are based on the most recent Mortgage that was taken out on this home.
Original Mortgage
$2,850,000
Outstanding Balance
$2,848,975
Interest Rate
6.88%
Mortgage Type
Credit Line Revolving
Estimated Equity
-$888,166
Purchase Details
Closed on
Mar 29, 1996
Sold by
Ueno Kay
Bought by
Ueno Kay
Create a Home Valuation Report for This Property
The Home Valuation Report is an in-depth analysis detailing your home's value as well as a comparison with similar homes in the area
Home Values in the Area
Average Home Value in this Area
Purchase History
| Date | Buyer | Sale Price | Title Company |
|---|---|---|---|
| Ueno Kurt Y | -- | Fidelity National Title Compan | |
| Ueno Kurt Y | -- | Fidelity National Title Compan | |
| Ueno Kay | -- | -- |
Source: Public Records
Mortgage History
| Date | Status | Borrower | Loan Amount |
|---|---|---|---|
| Open | Ueno Kurt Y | $2,850,000 |
Source: Public Records
Tax History Compared to Growth
Tax History
| Year | Tax Paid | Tax Assessment Tax Assessment Total Assessment is a certain percentage of the fair market value that is determined by local assessors to be the total taxable value of land and additions on the property. | Land | Improvement |
|---|---|---|---|---|
| 2025 | $3,777 | $588,947 | $496,924 | $92,023 |
| 2024 | $3,777 | $92,806 | $26,017 | $66,789 |
| 2023 | $5,539 | $90,987 | $25,507 | $65,480 |
| 2022 | $5,473 | $89,204 | $25,007 | $64,197 |
| 2021 | $5,279 | $87,456 | $24,517 | $62,939 |
| 2020 | $5,019 | $86,560 | $24,266 | $62,294 |
| 2019 | $4,854 | $84,864 | $23,791 | $61,073 |
| 2018 | $4,770 | $83,201 | $23,325 | $59,876 |
| 2017 | $2,824 | $81,570 | $22,868 | $58,702 |
| 2016 | $1,894 | $79,971 | $22,420 | $57,551 |
| 2015 | $2,310 | $78,771 | $22,084 | $56,687 |
| 2014 | $1,511 | $77,229 | $21,652 | $55,577 |
Source: Public Records
Map
Nearby Homes
- 1148 Willow Glen Way
- 1327 Pine Ave
- 1037 Hazelwood Ave
- 1109 Lincoln Ct
- 947 Terra Bella Ave
- 1152 Curtner Ave
- 1020 Michigan Ave
- 2213 Hicks Ave
- 2177 Cheryl Way
- 2106 Marques Ave
- 1629 Fruitwood Ct
- 1077 Cumberland Place
- 1148 Husted Ave
- 1567 Hamilton Ave
- 2070 Almaden Rd
- 2206 Almaden Rd Unit B
- 2296 Almaden Rd Unit B
- 1275 Bird Ave
- 1197 Willow St
- 2150 Almaden Rd Unit 103
- 1233 Norval Way
- 1253 Norval Way
- 1244 Laurie Ave
- 1223 Norval Way
- 1263 Norval Way
- 1240 Laurie Ave
- 1242 Norval Way
- 1224 Laurie Ave
- 1254 Norval Way
- 1213 Norval Way
- 1232 Norval Way
- 1848 Marlyn Way
- 1816 Marlyn Way
- 1210 Laurie Ave
- 1264 Norval Way
- 1222 Norval Way
- 1802 Marlyn Way
- 1845 Newport Ave
- 1815 Newport Ave
- 1274 Norval Way