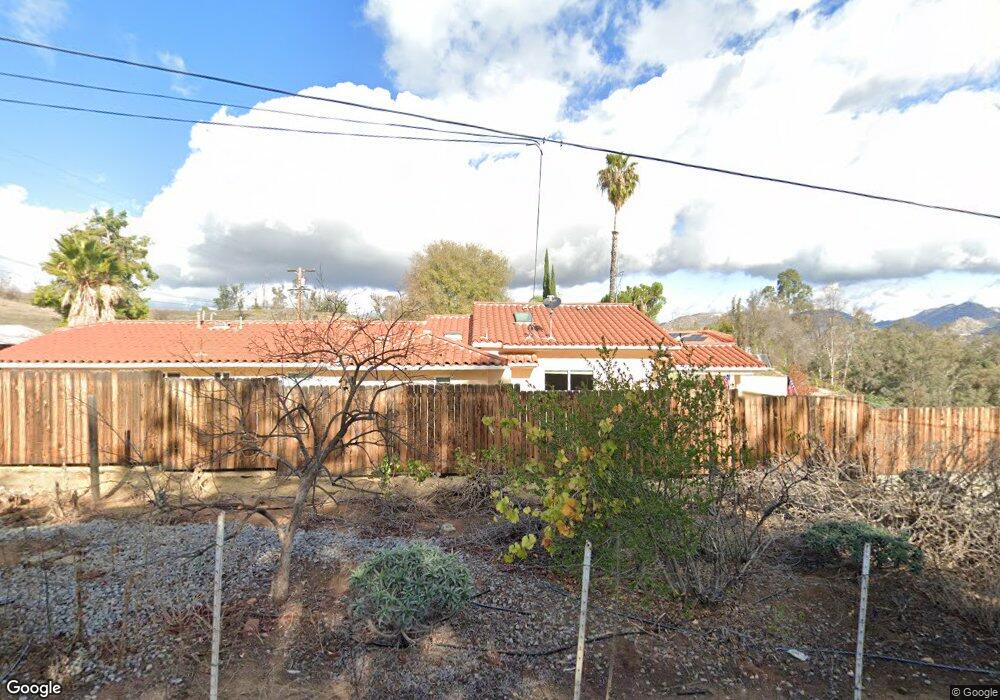
12435 Lemon Crest Dr Lakeside, CA 92040
Estimated Value: $940,000 - $1,307,000
7
Beds
4
Baths
3,369
Sq Ft
$335/Sq Ft
Est. Value
About This Home
This home is located at 12435 Lemon Crest Dr, Lakeside, CA 92040 and is currently estimated at $1,127,260, approximately $334 per square foot. 12435 Lemon Crest Dr is a home located in San Diego County with nearby schools including Lemon Crest Elementary School, Lakeside Middle School, and El Capitan High School.
Ownership History
Date
Name
Owned For
Owner Type
Purchase Details
Closed on
Jan 24, 2017
Sold by
Rosson Joanne I
Bought by
Rosson Lee R and Rosson Shelly A
Current Estimated Value
Home Financials for this Owner
Home Financials are based on the most recent Mortgage that was taken out on this home.
Original Mortgage
$483,000
Outstanding Balance
$401,018
Interest Rate
4.3%
Mortgage Type
New Conventional
Estimated Equity
$726,242
Purchase Details
Closed on
Jun 1, 2009
Sold by
Rosson Joanne I
Bought by
Rosson Joanne I
Home Financials for this Owner
Home Financials are based on the most recent Mortgage that was taken out on this home.
Original Mortgage
$858,000
Outstanding Balance
$505,859
Interest Rate
3.56%
Mortgage Type
Reverse Mortgage Home Equity Conversion Mortgage
Estimated Equity
$621,401
Purchase Details
Closed on
Dec 19, 1995
Sold by
Rosson Kenneth L and Rosson Joanne I
Bought by
Rosson Kenneth L and Rosson Joanne I
Purchase Details
Closed on
Aug 19, 1986
Create a Home Valuation Report for This Property
The Home Valuation Report is an in-depth analysis detailing your home's value as well as a comparison with similar homes in the area
Home Values in the Area
Average Home Value in this Area
Purchase History
| Date | Buyer | Sale Price | Title Company |
|---|---|---|---|
| Rosson Lee R | -- | Tsi | |
| Rosson Joanne I | -- | Placer Title Company | |
| Rosson Kenneth L | -- | -- | |
| -- | $152,500 | -- |
Source: Public Records
Mortgage History
| Date | Status | Borrower | Loan Amount |
|---|---|---|---|
| Open | Rosson Lee R | $483,000 | |
| Open | Rosson Joanne I | $858,000 |
Source: Public Records
Tax History
| Year | Tax Paid | Tax Assessment Tax Assessment Total Assessment is a certain percentage of the fair market value that is determined by local assessors to be the total taxable value of land and additions on the property. | Land | Improvement |
|---|---|---|---|---|
| 2025 | $3,939 | $322,586 | $97,602 | $224,984 |
| 2024 | $3,939 | $316,262 | $95,689 | $220,573 |
| 2023 | $3,800 | $310,062 | $93,813 | $216,249 |
| 2022 | $8,846 | $735,823 | $446,750 | $289,073 |
| 2021 | $9,150 | $757,770 | $429,403 | $328,367 |
| 2020 | $3,572 | $295,375 | $89,247 | $206,128 |
| 2019 | $9,954 | $289,585 | $87,498 | $202,087 |
| 2018 | $9,911 | $283,908 | $85,783 | $198,125 |
| 2017 | $822 | $278,342 | $84,101 | $194,241 |
| 2016 | $3,320 | $272,885 | $82,452 | $190,433 |
| 2015 | $3,296 | $268,787 | $81,214 | $187,573 |
| 2014 | $3,131 | $263,523 | $79,624 | $183,899 |
Source: Public Records
Map
Nearby Homes
- 12327 Lemon Crest Dr
- 12307 Lemon Crest Dr
- 9362 Single Oak Dr
- 9620 Los Coches Rd
- 12403 Julian Ave Unit 206
- 12635 Castle Court Dr
- 12525 Julian Ave
- 12120 Rockcrest Rd
- 12156 Wintergreen Dr Unit 1
- 12158 Orange Crest Ct Unit 1
- 12736 Castle Court Dr
- 12886 Castle Court Dr
- 9100 Single Oak Dr Unit 67
- 9100 Single Oak Dr Unit 110
- 9100 Single Oak Dr Unit 95
- 9100 Single Oak Dr Unit 23
- 9100 Single Oak Dr Unit 88
- 9100 Single Oak Dr Unit 8
- 12118 Lemon Crest Dr Unit 2
- 9379 Winter Gardens Blvd Unit 10
- 12435 1/2 Lemon Crest Dr
- 12443 Lemon Crest Dr
- 12361 Lemon Crest Dr
- 12500 Del Sol Rd
- 12515 Del Sol Rd
- 9480 Rockcrest Ln
- 12511 Del Sol Rd
- 9460 Rockcrest Ln
- 12509 Del Sol Rd
- 12507 Del Sol Rd
- 9475 Rockcrest Ln
- 9456 Rockcrest Ln
- 12565 Del Sol Rd
- 12503 Del Sol Rd
- 9459 Rockcrest Ln
- 12551 Del Sol Rd
- 12555 Amy Way
- 12561 Amy Way
- 9508 Leyendekker Ct
- 9502 Leyendekker Ct
Your Personal Tour Guide
Ask me questions while you tour the home.