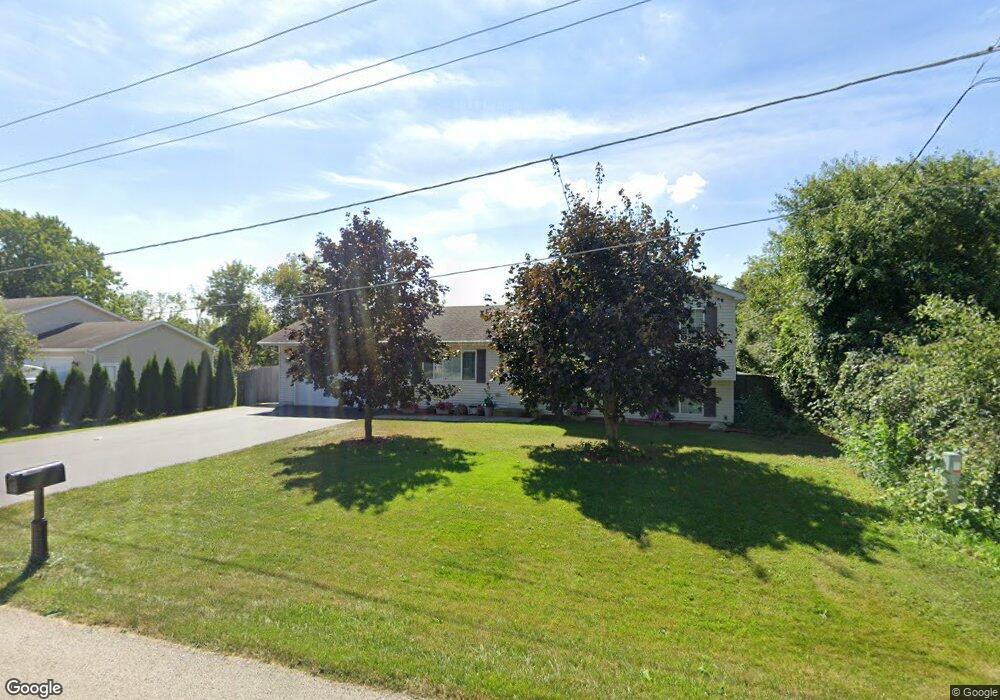
12437 W Grandmore Ave Waukegan, IL 60085
Shore Highlands NeighborhoodEstimated Value: $242,000 - $326,000
3
Beds
2
Baths
1,180
Sq Ft
$250/Sq Ft
Est. Value
About This Home
This home is located at 12437 W Grandmore Ave, Waukegan, IL 60085 and is currently estimated at $295,200, approximately $250 per square foot. 12437 W Grandmore Ave is a home located in Lake County with nearby schools including Glenwood Elementary School, Miguel Juarez Middle School, and Waukegan High School.
Ownership History
Date
Name
Owned For
Owner Type
Purchase Details
Closed on
Jan 5, 2015
Sold by
Willcox Terry N and Willcox Mirna A
Bought by
Mahoney Daniel E and Mahoney Margaret M
Current Estimated Value
Home Financials for this Owner
Home Financials are based on the most recent Mortgage that was taken out on this home.
Original Mortgage
$111,000
Interest Rate
4.25%
Mortgage Type
New Conventional
Purchase Details
Closed on
Dec 30, 2013
Sold by
Gust Fred and Gust Patricia
Bought by
Willcox Terry N and Willcox Mirna A
Home Financials for this Owner
Home Financials are based on the most recent Mortgage that was taken out on this home.
Original Mortgage
$133,081
Interest Rate
4.23%
Mortgage Type
VA
Purchase Details
Closed on
Dec 7, 2010
Sold by
Bahena Savelia
Bought by
Gust Fred and Gust Patricia
Purchase Details
Closed on
Feb 10, 2006
Sold by
Dittmer Janice E and Dittmer Carolyn A
Bought by
Gust Fred and Gust Patricia
Create a Home Valuation Report for This Property
The Home Valuation Report is an in-depth analysis detailing your home's value as well as a comparison with similar homes in the area
Home Values in the Area
Average Home Value in this Area
Purchase History
| Date | Buyer | Sale Price | Title Company |
|---|---|---|---|
| Mahoney Daniel E | $50,000 | Chicago Title Insurance Co | |
| Willcox Terry N | $128,830 | None Available | |
| Gust Fred | -- | None Available | |
| Gust Fred | $30,000 | None Available |
Source: Public Records
Mortgage History
| Date | Status | Borrower | Loan Amount |
|---|---|---|---|
| Previous Owner | Mahoney Daniel E | $111,000 | |
| Previous Owner | Willcox Terry N | $133,081 |
Source: Public Records
Tax History Compared to Growth
Tax History
| Year | Tax Paid | Tax Assessment Tax Assessment Total Assessment is a certain percentage of the fair market value that is determined by local assessors to be the total taxable value of land and additions on the property. | Land | Improvement |
|---|---|---|---|---|
| 2024 | $5,353 | $95,956 | $7,911 | $88,045 |
| 2023 | $5,568 | $86,361 | $6,956 | $79,405 |
| 2022 | $5,568 | $77,722 | $6,852 | $70,870 |
| 2021 | $5,937 | $78,351 | $6,799 | $71,552 |
| 2020 | $4,209 | $72,993 | $6,334 | $66,659 |
| 2019 | $5,920 | $66,886 | $5,804 | $61,082 |
| 2018 | $4,867 | $55,211 | $6,572 | $48,639 |
| 2017 | $5,193 | $48,846 | $5,814 | $43,032 |
| 2016 | $4,863 | $42,445 | $5,052 | $37,393 |
| 2015 | $4,647 | $37,989 | $4,522 | $33,467 |
| 2014 | $3,674 | $25,335 | $3,151 | $22,184 |
| 2012 | $4,696 | $27,449 | $3,414 | $24,035 |
Source: Public Records
Map
Nearby Homes
- 2813 Theresa Ave
- 12698 W Grandview Ave
- 12716 W Grandview Ave
- 2810 W Atlantic Ave
- 3210 W Grandview Ave
- 35400 N Green Bay Rd
- 621 N Austin Ave
- 34887 N Austin Ave
- 603 N Austin Ave
- 3409 Glen Flora Ave
- 1430 N Green Bay Rd
- 2715 W Greenwood Ave
- 12352 W Atlantic Ave
- 963 Belle Plaine Ave
- 1048 Belle Plaine Ave
- 525 Lawrence Ave
- 1414 Belle Plaine Ave
- 3482 Ellis Ave
- 615 Tiffany Dr
- 2440 W Cheyenne Rd
- 12455 W Grandmore Ave
- 12419 W Grandmore Ave
- 35333 N Northern Ave
- 12436 W Grandmore Ave
- 35397 N Northern Ave
- 12418 W Grandmore Ave
- 12393 W Grandmore Ave
- 12392 W Grandmore Ave
- 12437 W Crescent Ave
- 35291 N Northern Ave
- 12419 W Crescent Ave
- 12455 W Crescent Ave
- 1036 N Frolic Ave
- 12393 W Crescent Ave
- 2881 W Grandmore Ave
- 12360 W Grandmore Ave
- 1030 N Frolic Ave
- 2916 W Grandville Ave
- 35269 N Northern Ave