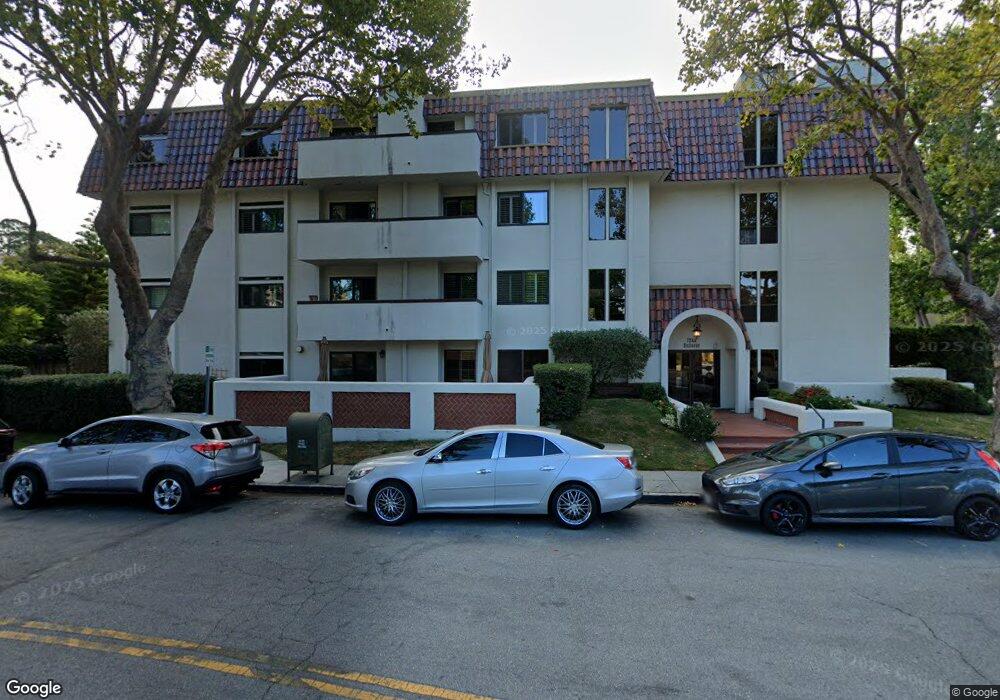
1244 Bellevue Ave Unit 6 Burlingame, CA 94010
Downtown Burlingame NeighborhoodEstimated Value: $1,047,000 - $1,501,000
2
Beds
2
Baths
1,397
Sq Ft
$912/Sq Ft
Est. Value
About This Home
This home is located at 1244 Bellevue Ave Unit 6, Burlingame, CA 94010 and is currently estimated at $1,273,427, approximately $911 per square foot. 1244 Bellevue Ave Unit 6 is a home located in San Mateo County with nearby schools including McKinley Elementary School, Burlingame Intermediate School, and Burlingame High School.
Ownership History
Date
Name
Owned For
Owner Type
Purchase Details
Closed on
Jan 28, 2013
Sold by
Rohani Behdokht
Bought by
Rohani Behdokht
Current Estimated Value
Purchase Details
Closed on
May 16, 2012
Sold by
Tara Moayer Mehran Farid and Tara Esmeili
Bought by
Rohani Behdokht
Purchase Details
Closed on
Jun 12, 2006
Sold by
Platz Robert M and Platz Josephine B
Bought by
Tara Moayer Mehran Farid and Tara Esmeili
Home Financials for this Owner
Home Financials are based on the most recent Mortgage that was taken out on this home.
Original Mortgage
$616,000
Interest Rate
6.37%
Mortgage Type
Purchase Money Mortgage
Purchase Details
Closed on
Mar 2, 1995
Sold by
Lewis Richard and Lewis Gerald
Bought by
Platz Robert M and Platz Josephine B
Home Financials for this Owner
Home Financials are based on the most recent Mortgage that was taken out on this home.
Original Mortgage
$240,000
Interest Rate
8.86%
Mortgage Type
Purchase Money Mortgage
Create a Home Valuation Report for This Property
The Home Valuation Report is an in-depth analysis detailing your home's value as well as a comparison with similar homes in the area
Home Values in the Area
Average Home Value in this Area
Purchase History
| Date | Buyer | Sale Price | Title Company |
|---|---|---|---|
| Rohani Behdokht | -- | None Available | |
| Rohani Behdokht | $620,000 | First American Title Company | |
| Tara Moayer Mehran Farid | $770,000 | First American Title Company | |
| Platz Robert M | $300,000 | North American Title Insuran |
Source: Public Records
Mortgage History
| Date | Status | Borrower | Loan Amount |
|---|---|---|---|
| Previous Owner | Tara Moayer Mehran Farid | $616,000 | |
| Previous Owner | Platz Robert M | $240,000 |
Source: Public Records
Tax History Compared to Growth
Tax History
| Year | Tax Paid | Tax Assessment Tax Assessment Total Assessment is a certain percentage of the fair market value that is determined by local assessors to be the total taxable value of land and additions on the property. | Land | Improvement |
|---|---|---|---|---|
| 2025 | $8,855 | $778,739 | $233,619 | $545,120 |
| 2023 | $8,855 | $748,502 | $224,549 | $523,953 |
| 2022 | $8,546 | $733,827 | $220,147 | $513,680 |
| 2021 | $8,559 | $719,439 | $215,831 | $503,608 |
| 2020 | $8,385 | $712,063 | $213,618 | $498,445 |
| 2019 | $8,202 | $698,102 | $209,430 | $488,672 |
| 2018 | $8,049 | $684,415 | $205,324 | $479,091 |
| 2017 | $7,992 | $670,997 | $201,299 | $469,698 |
| 2016 | $7,697 | $657,841 | $197,352 | $460,489 |
| 2015 | $7,664 | $647,961 | $194,388 | $453,573 |
| 2014 | $7,555 | $635,270 | $190,581 | $444,689 |
Source: Public Records
Map
Nearby Homes
- 1133 Douglas Ave Unit 3
- 1121 Douglas Ave Unit 201
- 1427 Floribunda Ave Unit 304
- 1433 Floribunda Ave Unit 5
- 1433 Floribunda Ave Unit 7
- 1433 Floribunda Ave Unit 2
- 1433 Floribunda Ave Unit 1
- 712 Crossway Rd
- 1515 Floribunda Ave Unit 309
- 1515 Floribunda Ave Unit 302
- 737 Linden Ave
- 550 El Camino Real Unit 302
- 732 Paloma Ave
- 735 El Camino Real Unit 104
- 1030 Morrell Ave
- 110 Park Rd Unit 103
- 777 Morrell Ave Unit 302
- 733 Lexington Way
- 30 Lorton Ave Unit 105
- 824 El Camino Real
- 1244 Bellevue Ave Unit 3
- 1244 Bellevue Ave
- 1244 Bellevue Ave Unit 7
- 1244 Bellevue Ave Unit 5
- 1244 Bellevue Ave Unit 4
- 1244 Bellevue Ave Unit 3
- 1244 Bellevue Ave Unit 2
- 1244 Bellevue Ave Unit 1
- 1240 Bellevue Ave
- 1137 Douglas Ave
- 1236 Bellevue Ave
- 1138 Douglas Ave
- 1133 Douglas Ave Unit 303
- 1133 Douglas Ave Unit 103
- 1133 Douglas Ave Unit 202
- 1133 Douglas Ave Unit 9
- 1133 Douglas Ave Unit 8
- 1133 Douglas Ave Unit 301
- 1133 Douglas Ave Unit 6
- 1133 Douglas Ave Unit 5