1244 E Divot Dr Unit Sharp Tempe, AZ 85283
South Tempe NeighborhoodEstimated Value: $414,000 - $447,000
3
Beds
2
Baths
1,068
Sq Ft
$406/Sq Ft
Est. Value
About This Home
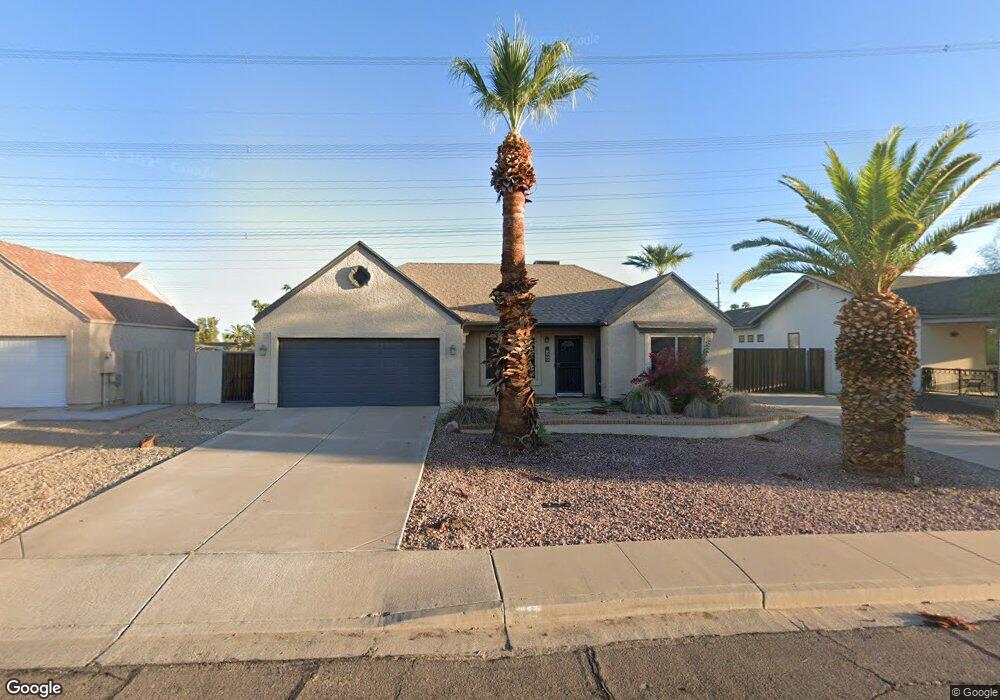
This home is located at 1244 E Divot Dr Unit Sharp, Tempe, AZ 85283 and is currently estimated at $434,036, approximately $406 per square foot. 1244 E Divot Dr Unit Sharp is a home located in Maricopa County with nearby schools including Kyrene de los Niños Elementary School, Kyrene del Norte School, and Kyrene Middle School.
Ownership History
Date
Name
Owned For
Owner Type
Purchase Details
Closed on
Dec 14, 2012
Sold by
Myers Elisabeth
Bought by
Myers Cluade M
Current Estimated Value
Purchase Details
Closed on
Jun 6, 2003
Sold by
Menear Glenn P and Menear Kelly C
Bought by
Myers Claude M and Myers Elisabeth
Home Financials for this Owner
Home Financials are based on the most recent Mortgage that was taken out on this home.
Original Mortgage
$112,800
Outstanding Balance
$43,003
Interest Rate
4%
Mortgage Type
Purchase Money Mortgage
Estimated Equity
$391,034
Purchase Details
Closed on
Sep 20, 1994
Sold by
Turner James D and Turner Mary L
Bought by
Menear Glenn P and Menear Kelly C
Create a Home Valuation Report for This Property
The Home Valuation Report is an in-depth analysis detailing your home's value as well as a comparison with similar homes in the area
Home Values in the Area
Average Home Value in this Area
Purchase History
| Date | Buyer | Sale Price | Title Company |
|---|---|---|---|
| Myers Cluade M | -- | None Available | |
| Myers Claude M | $141,000 | Stewart Title & Tr Phoenix | |
| Menear Glenn P | $90,520 | Transamerica Title Ins Co |
Source: Public Records
Mortgage History
| Date | Status | Borrower | Loan Amount |
|---|---|---|---|
| Open | Myers Claude M | $112,800 |
Source: Public Records
Tax History
| Year | Tax Paid | Tax Assessment Tax Assessment Total Assessment is a certain percentage of the fair market value that is determined by local assessors to be the total taxable value of land and additions on the property. | Land | Improvement |
|---|---|---|---|---|
| 2025 | $1,857 | $19,874 | -- | -- |
| 2024 | $1,751 | $18,928 | -- | -- |
| 2023 | $1,751 | $31,100 | $6,220 | $24,880 |
| 2022 | $1,660 | $23,560 | $4,710 | $18,850 |
| 2021 | $1,725 | $22,580 | $4,510 | $18,070 |
| 2020 | $1,684 | $20,930 | $4,180 | $16,750 |
| 2019 | $1,631 | $19,110 | $3,820 | $15,290 |
| 2018 | $1,576 | $17,180 | $3,430 | $13,750 |
| 2017 | $1,511 | $16,300 | $3,260 | $13,040 |
| 2016 | $1,532 | $15,420 | $3,080 | $12,340 |
| 2015 | $1,415 | $13,850 | $2,770 | $11,080 |
Source: Public Records
Map
Nearby Homes
- 987 E Divot Dr
- 6743 S Newberry Rd
- 6736 S Stanley Place
- 1125 E Lodge Dr
- 1011 E Redfield Rd
- 1032 E Redfield Rd
- 1033 E Bendix Dr
- 6815 S Juniper St
- 6833 S Jentilly Ln
- 1315 E Mcnair Dr
- 6801 S Palm Dr
- 831 E Divot Dr
- 920 E Mcnair Dr
- 1070 E Sunburst Ln
- 1231 E Sunburst Ln
- 1455 E Brentrup Dr
- 1338 E Sunburst Ln
- 738 E Strahan Dr
- 7716 S Rita Ln Unit 3
- 1402 E Guadalupe Rd Unit 153
- 1244 E Divot Dr
- 1252 E Divot Dr
- 1238 E Divot Dr
- 1230 E Divot Dr
- 1260 E Divot Dr
- 1245 E Divot Dr
- 1251 E Divot Dr
- 1237 E Divot Dr
- 1228 E Divot Dr
- 1259 E Divot Dr
- 1231 E Divot Dr
- 1227 E Divot Dr Unit 1
- 1226 E Divot Dr
- 1302 E Divot Dr
- 1402 E Divot Dr
- 1183 E Diamond Dr
- 1301 E Divot Dr
- 6916 S Lakeshore Dr
- 7103 S Stanley Place
- 1179 E Diamond Dr
Your Personal Tour Guide
Ask me questions while you tour the home.